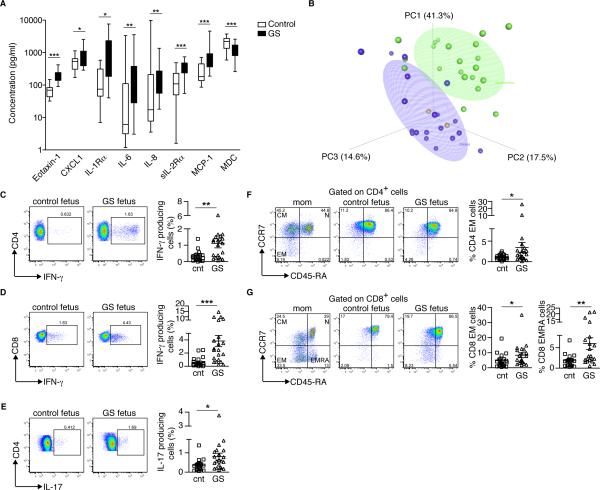
FIGURE 1.
Elevated inflammatory markers and T cell activation in the cord blood of patients with gastroschisis. (A) Comparison of cytokine levels in unaffected controls (white, n=19) and patients with gastroschisis (black, n=21). The horizontal line represents the median for each group. *p=0.05; **p<0.01; ***p<0.001 by Mann-Whitney rank sum test. MCP-1, Monocyte Chemoattractant Protein-1; MDC, Macrophage-Derived Chemokine. (B) Supervised Principal Component Analysis (sPCA) of the cord blood biomarkers most significantly correlated with gastroschisis in healthy controls (n=19; blue), patients with gastroschisis (n=21; green) and patients with giant omphalocele (n=2; orange). Ellipsoids represent a 50% concentration of observations for controls and patients with gastroschisis. Eotaxin-1, IL-1Rα, IL-6, IL-8 and MCP-1 had the highest factor loadings on PC1. (C-E) Cord blood PBMCs were stimulated with PMA and Ionomycin and stained with antibodies to CD3, CD4, CD8, IL-17 and IFN-γ to determine the percentage of T cells producing each cytokine. (C) IFN-γ production by CD4+ T cells. (D) IFN-γ production by CD8+ T cells. (E) IL-17 production by CD4+ T cells. Each symbol represents a single patient; small horizontal bars indicate the mean. (F and G) On the left side, representative flow cytometric analysis of purified maternal and cord blood PBMCs from healthy controls and patients with gastroschisis stained with antibodies to CD3, CD4, CD8, CD45RA and CCR7 to detect naïve (N: CCR7+CD45RA+), central memory (CM: CCR7+CD45RA−) and effector memory (EM: CCR7−CD45RA−; EMRA: CCR7−CD45RA+) cells. On the right side, compiled analysis for cord blood (F) CD4+ EM T cells, (G) CD8+ EM T cells and CD8+ EMRA T cells. Each symbol represents a single patient; small horizontal bars indicate the mean. Control n=20, gastroschisis n=21. *p<0.05; **p<0.01; ***p<0.001 by Mann-Whitney test.

