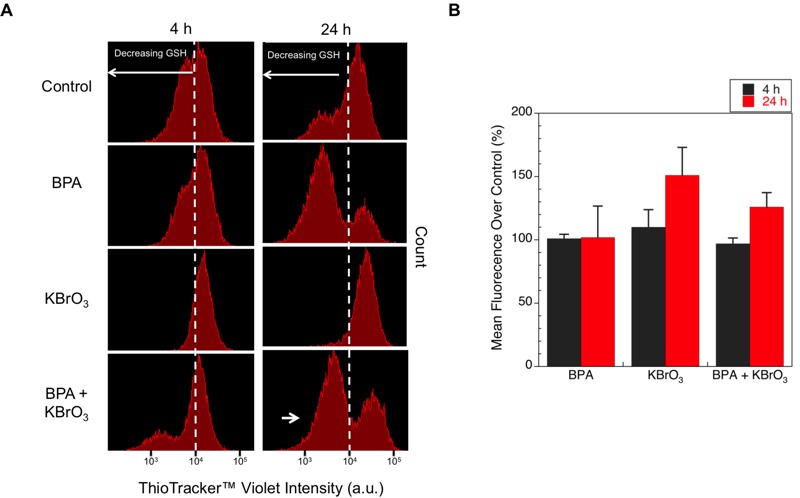
Figure 6.

Levels of free GSH after treatment with KBrO3, BPA, or co-exposure to both agents at 4 and 24 hr post-damage induction were measured by staining live cells with ThiolTracker™ Violet and sorting by flow cytometry. (A) ThiolTracker™ Violet live cells were sorted by intensity, and the measured intensities for a representative experiment at 4 and 24 hr are shown. Dashed lines indicate the center of the intensity peak for the control cells and highlight the relative changes in measured intensity compared with the control cells. The long white arrows indicate the direction of decreasing GSH measured by loss of dye intensity. The short white arrow indicates the subpopulation reflecting lower GSH content. (B) Mean intensity values of the ThiolTracker™ Violet staining for each treatment condition 4 hr (black) and 24 hr (red) after damage induction normalized to the control are shown (mean ± SEM of 3 replicates).
