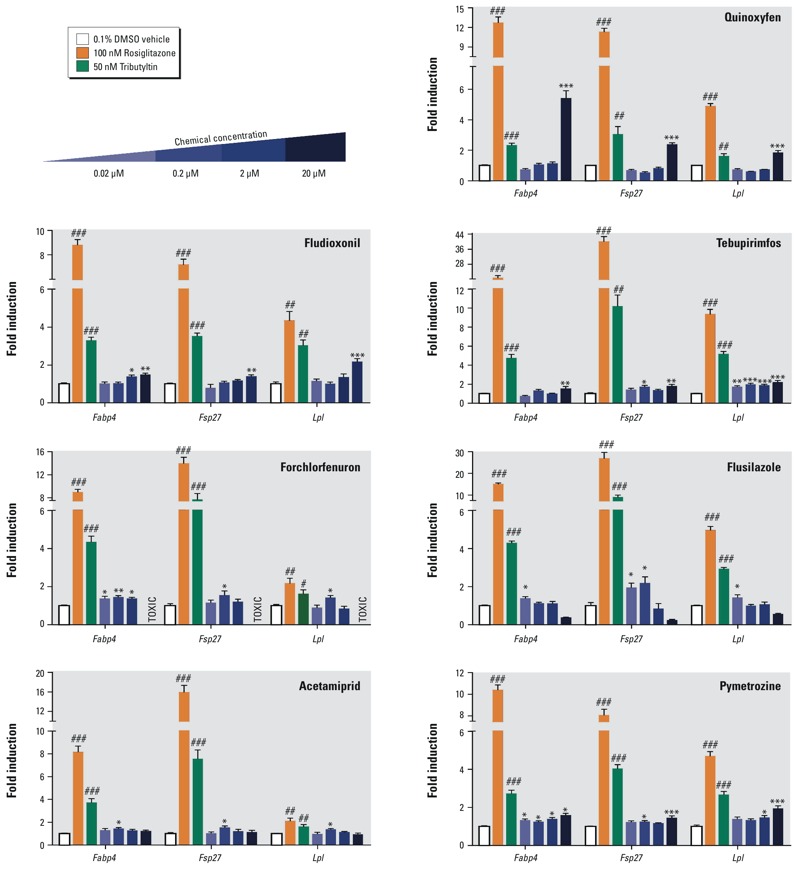
Figure 6.

ToxPi chemicals induce adipogenic gene expression in 3T3-L1 preadipocytes. Adipogenesis was induced in 3T3-L1 cells according to Figure S2. 3T3-L1 cells were exposed to adipogenic cocktail for 2 days, then exposed to the test chemicals for 5 days. 3T3-L1 cells were homogenized in TriPure, total RNA was isolated, reverse transcribed, and QPCR was performed. Gene expression was determined by the 2– ΔΔ CT method using 36b4 as the reference gene. Data are reported as fold induction over 0.1% DMSO vehicle controls ± S.E.M using standard propagation of error. Primer sequences can be found in Table S4. One-way ANOVA was conducted for ToxPi treatment groups and DMSO vehicle, followed by Dunnett’s post hoc test: *p ≤ 0.05, **p ≤ 0.01, ***p ≤ 0.001 compared to vehicle. Unpaired t-test was conducted for the positive controls ROSI, TBT versus vehicle: # p ≤ 0.05, ## p ≤ 0.01, ### p ≤ 0.001.
