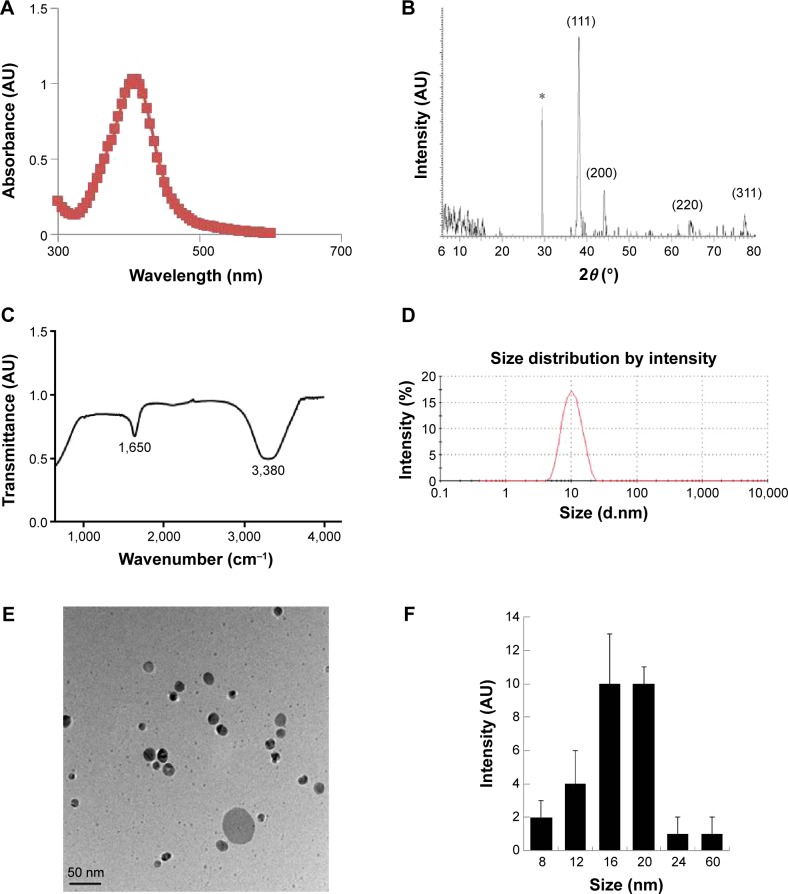
Figure 1.
Synthesis and characterization of AgNPs using Bacillus clausii.
Notes: (A) The absorption spectrum of AgNPs synthesized by the culture supernatant of Bacillus clausii. (B) X-ray diffraction spectra of AgNPs. (C) Fourier transform infrared spectra of AgNPs. (D) Measurement of size distribution of AgNPs by DLS. (E) TEM images of AgNPs. (F) Several fields were used to measure the AgNP particle size; micrograph shows size distributions based on TEM images of AgNPs ranging from 8 nm to 20 nm. *Indicate the nonspecific peaks due to organic compounds.
Abbreviations: AgNPs, silver nanoparticles; DLS, dynamic light scattering; TEM, transmission electron microscopy.

