Figure 7. WizMommeD30/+ mice show decreased activity and increased anxiety-like behaviour.
(A) Line graph illustrating the average 24 hr activity profile from Wiz+/+ and WizMommeD30/+ mice, collapsed from 12 days of testing. The pattern of activity is broadly similar between the genotypes, though WizMommeD30/+ mice show decreased activity in the first two hours and the fifth hour of the active phase of the light/dark cycle. Grey box indicates the dark phase of the light/dark cycle. (B) Bar graph showing decreased open arm entries among WizMommeD30/+ mice compared with Wiz+/+ mice, after 5 min intervals on the EPM test. (C) Heat map of locomotor activity on the EPM from a representative Wiz+/+ mouse (top) and a representative WizMommeD30/+ mouse (bottom). Broken lines indicate the location of the closed arms of the EPM. (D) Percentage of time Wiz+/+ (n = 21) and WizMommeD30/+ (n = 22) mice spent in the light portion of a light-dark test. (E) The number of vertical counts (rearing) Wiz+/+ and WizMommeD30/+ mice showed in the light-dark test. Error bars represent ± SEM, *p-value <0.05, **p-value 0.005, ***p-value <0.0005.
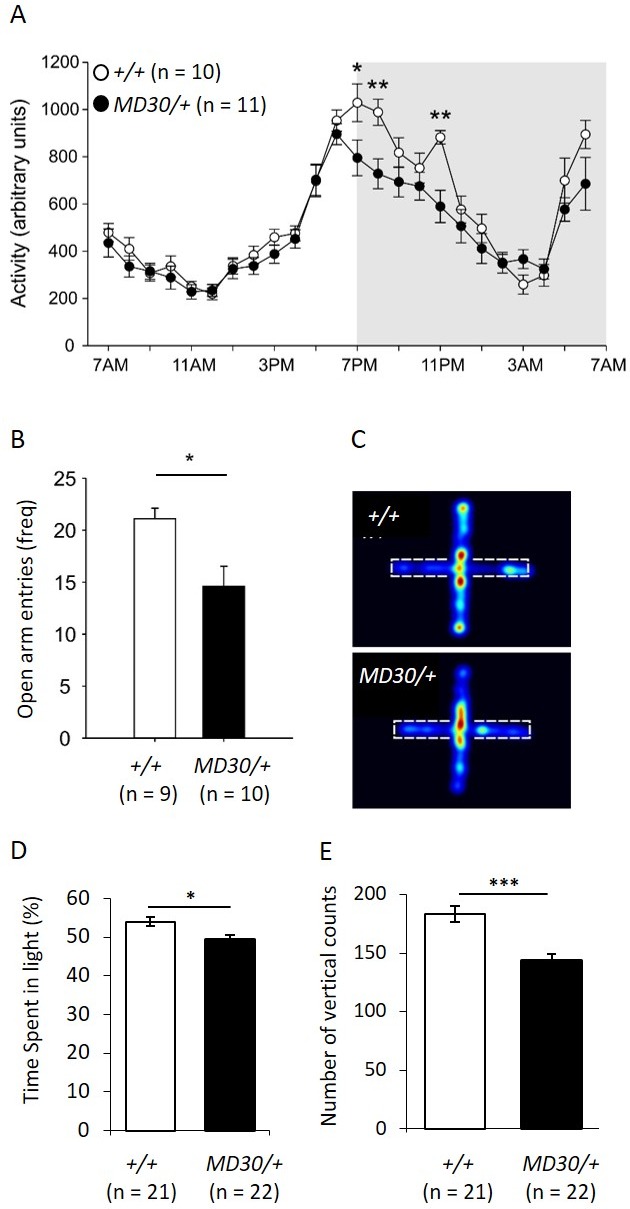
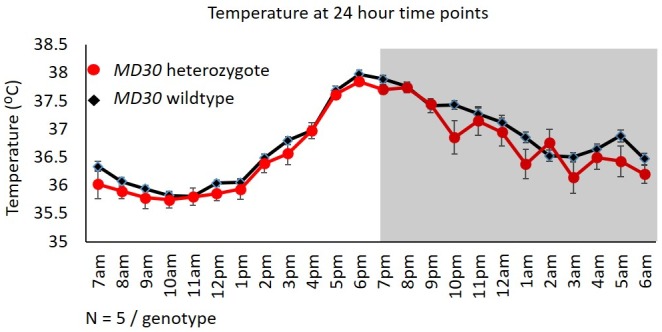
Figure 7—figure supplement 1. No difference in temperature in WizMommeD30/+ mice.