. 2016 Aug 8;5:e14694. doi: 10.7554/eLife.14694

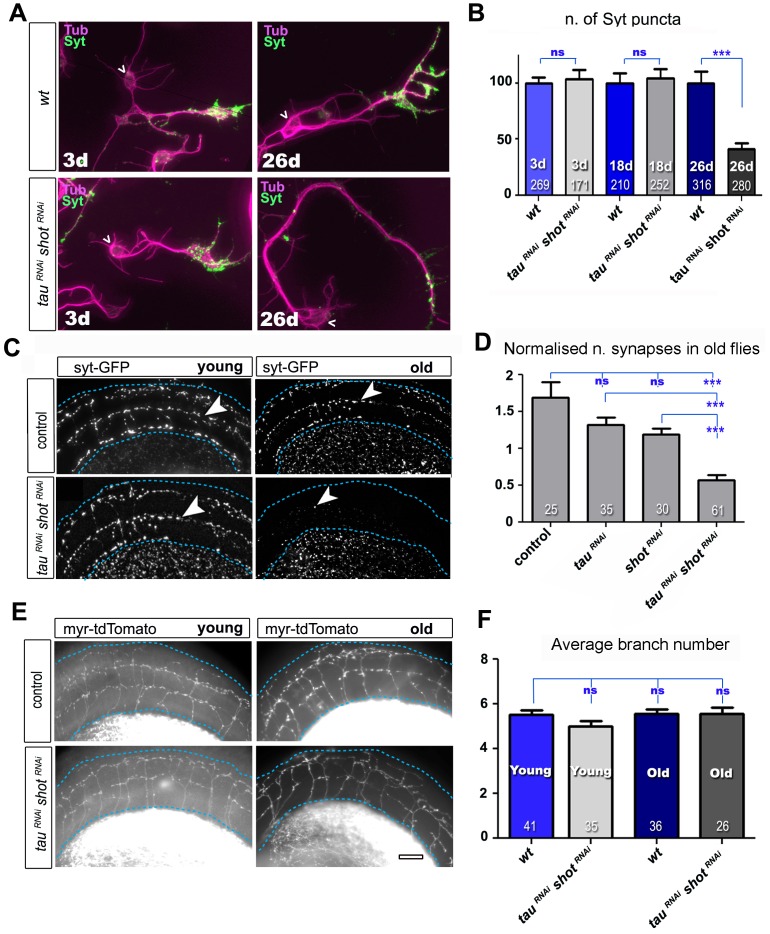
Figure 3. Tau and Shot are required for the maintenance of synaptic markers in cultured neurons and the ageing adult fly brain.

(A) Primary neurons at 3 DIV and 26 DIV cultured from embryos that were wildtype or jointly expressing UAS-tauRNAi and UAS-shotRNAi in all neurons driven by the pan-neuronal driver elav-Gal4 (tauRNAi shotRNAi). Neurons are stained with anti-tubulin and anti-Syt; at 26 DIV, tauRNAi shotRNAineurons display a reduction in the number of Syt puncta when compared to wildtype. (B) Quantification of the experiments in A, shown as the number of Syt puncta per neuron at 3 DIV, 18 DIV and 26 DIV, normalised to wildtype controls (the number of assessed neurons is indicated in each bar; ***PMW<0.001; ns, not significant PMW>0.05). (C) A region of Drosophila adult brains including the medulla (delimited by dashed lines) where Syt-GFP is expressed in dorsal cluster neurons using atonal-Gal4, in the absence (control) or together with tauRNAi and shotRNAi (tauRNAi shotRNAi). Brains are stained with anti-GFP at 2–5 days (young) and 24–29 days (old) after eclosion. Note that GFP-labelled synapses (arrowheads) are decreased in old brains upon shot and tau knock-down. (D) Quantification of the experiments in C, showing the normalised number of Syt-GFP-labelled puncta in old specimen per mean number of puncta in young specimens for the following phenotypes: ato-Gal4 UAS-syt-GFP alone (control), co-expressing UAS-tauRNAi (tauRNAi), UAS-shotRNAi(shotRNAi), or both knock-down constructs (tauRNAi shotRNAi; the number of analysed brains is indicated in each bar, ***PMW<0.001; ns, not significant PMW>0.05). (E) Brain regions as in C, of animals expressing the membrane marker myr-tdTomato driven by ato-Gal4 revealing the morphology of the projections of dorsal cluster neurons within the medulla ; brains were from adults at 2–5 days (young) and 24–29 days (old) after eclosure, expressing myr-tdTomato either alone (control) or together with tauRNAi and shotRNAi(tauRNAi shotRNAi). (F) Quantification of the experiments in E, displayed as number of branches per axon projecting into the medulla (the number of axons analysed is indicated in each bar; ns, not significant PMW>0.05). Scale bar: 10 µm in A and 40 µm in C and E. A statistics summary of the data shown here is available in Figure 3—source data 1.

DOI: http://dx.doi.org/10.7554/eLife.14694.011

Figure 3—source data 1. Summary of the statistics from Figure 3B,D,F.
DOI: 10.7554/eLife.14694.012

Figure 3.

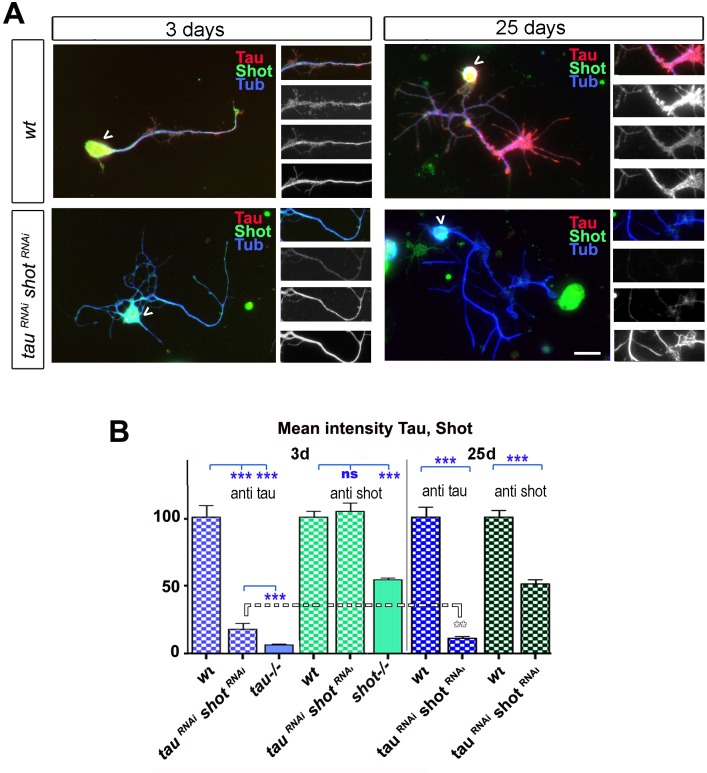
Figure 3—figure supplement 1. Delayed effect of RNAi mediated knock-down of Shot and Tau.

Figure 3—figure supplement 1.

(A) Primary neurons at 3 DIV and 25 DIV cultured from embryos that were wildtype or jointly expressing UAS-tauRNAi and UAS-shotRNAiin all neurons driven by the pan-neuronal driver elav-Gal4 (tauRNAi shotRNAi). Neurons are stained with antibodies against Tau, Shot and Tubulin (red, green and blue respectively); images on the right show: a selected axon segment taken from the main image (top) followed by grey scale images of the separated channels for Tau (2nd from top), Shot (3rd from top) and Tubulin (bottom). At 25 DIV, tauRNAi shotRNAineurons display a reduction in both Tau and Shot when compared to wildtype. (B) Quantification of the experiments in A, shown as mean intensity of Tau or Shot signal per neuron at 3 DIV and 25 DIV, normalised to wildtype controls (30–39 neurons were assessed per genotype; ***PMW<0.001; **PMW<0.01; ns, not significant PMW>0.05). Comparative data for shot3 and tauMR22 homozygous mutant neurons are given as control, indicating low Tau background staining and incomplete knock-down of Tau at 3 DIV, but high Shot background suggesting strong or complete Shot knock-down at 25 DIV. A statistics summary of the data shown here is available in Figure 3—figure supplement 1—source data 1.
Figure 3—figure supplement 1—source data 1. Summary of the statistics from Figure 3—figure supplement 1B.
DOI: 10.7554/eLife.14694.014
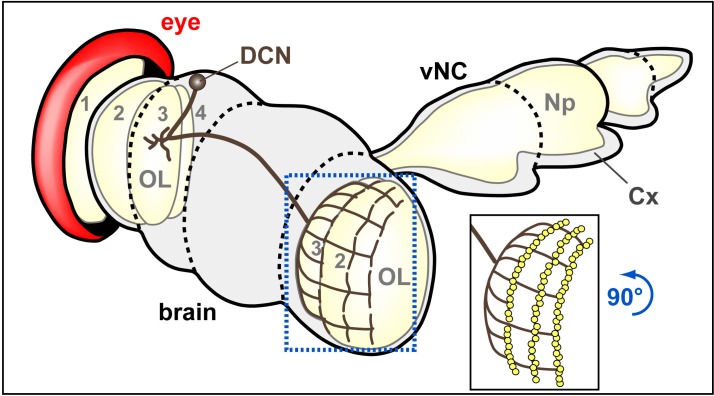
Figure 3—figure supplement 2. Schematic drawings of brain areas analysed in this study.

Figure 3—figure supplement 2.

Dorso-fronto-lateral view onto a schematic adult CNS composed of the brain and ventral nerve cord (vNC). Beige areas indicate some synaptic areas, in particular the ventral nerve cord neuropile (Np) and the optic lobes (OL) composed of lamina (1), medulla (2), lobula (3) and lobula plate (4). DCN neurons project to the optic lobe of the contralateral brain half where they branch out in a layered fashion. The blue stippled frame and image inset embox the area (rotated 90 degrees counterclockwise) shown in Figures 3E and 8E without and with synaptic markers (yellow dots), respectively.
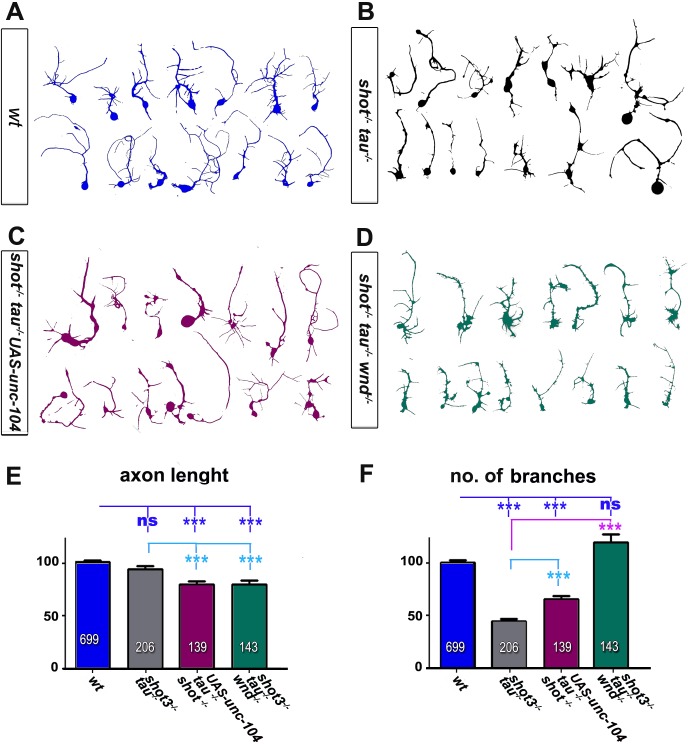
Figure 3—figure supplement 3. Loss of function mutations in shot and tau induce morphological changes.

Figure 3—figure supplement 3.

(AD) Representative examples of the shape of primary neurons at 2 DIV obtained from embryos that were wildtype (wt, A), shot3 tauMR22 (shot-/- tau-/-B), shot-/- tau-/- with elav-Gal4 driven expression of UAS-unc-104 (shot-/- tau-/- UAS-unc-104, C) and shot3 tauMR22 wnd2 (shot-/- tau-/- wnd-/- D). (E–F) Quantification of morphological parameters of experiment in (AD), including the length of axons (E) and the number of branches (F), (the assessed numbers of neurons are indicated in each bar, ***PMW<0.001; ns, not significant PMW>0.05). Note that wnd2 (wnd-/-) restored the number of branches in shot-tau mutant neurons, suggesting that JNK not only mediates synapse regulation but also morphogenetic processes downstream of the Shot-Tau deficiency. A statistics summary of the data shown here is available in Figure 3—figure supplement 3—source data 1.
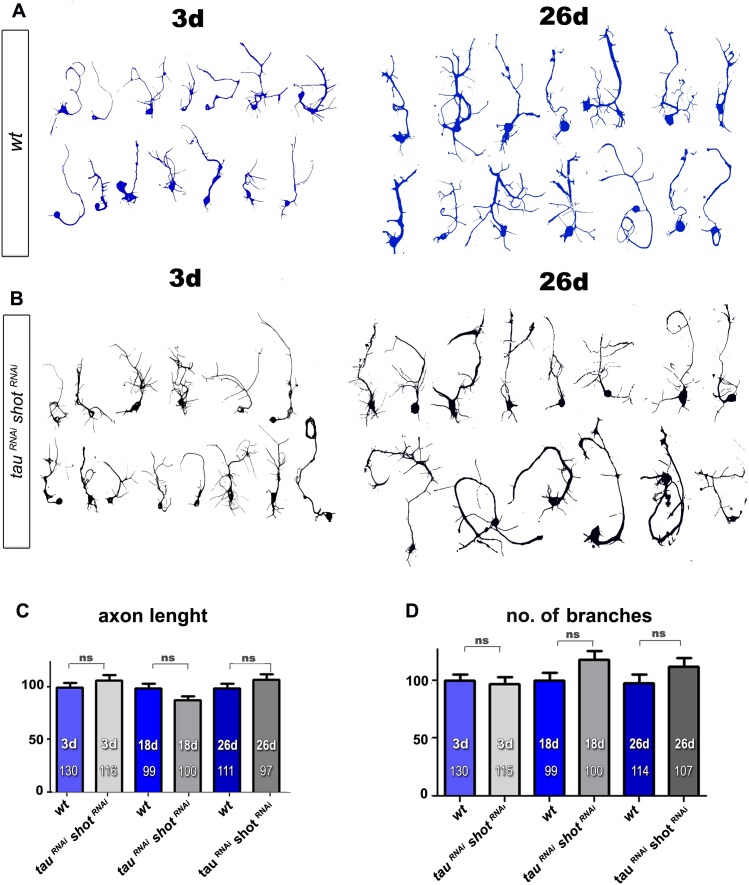
Figure 3—figure supplement 4. RNAi-mediated knock-down of Shot and Tau has no effect on axonal length and branch number.

Figure 3—figure supplement 4.

(AB) Representative examples of the shape of primary neurons at 3, 18 and 26 DIV obtained from embryos that were wildtype (wt, A) or jointly expressing UAS-tauRNAi and UAS-shotRNAi in all neurons driven by the pan-neuronal driver elav-Gal4 (tauRNAi shotRNAi, B). (CD) Quantification of morphological parameters of experiment in (AB), including the length of axons (C) and the number of branches (D), (the assessed numbers of neurons are indicated in each bar, ns, not significant PMW>0.05). A statistics summary of the data shown here is available in Figure 3—figure supplement 4—source data 1.
Figure 3—figure supplement 4—source data 1. Summary of the statistics from Figure 1—figure supplement 3C and D.
DOI: 10.7554/eLife.14694.018