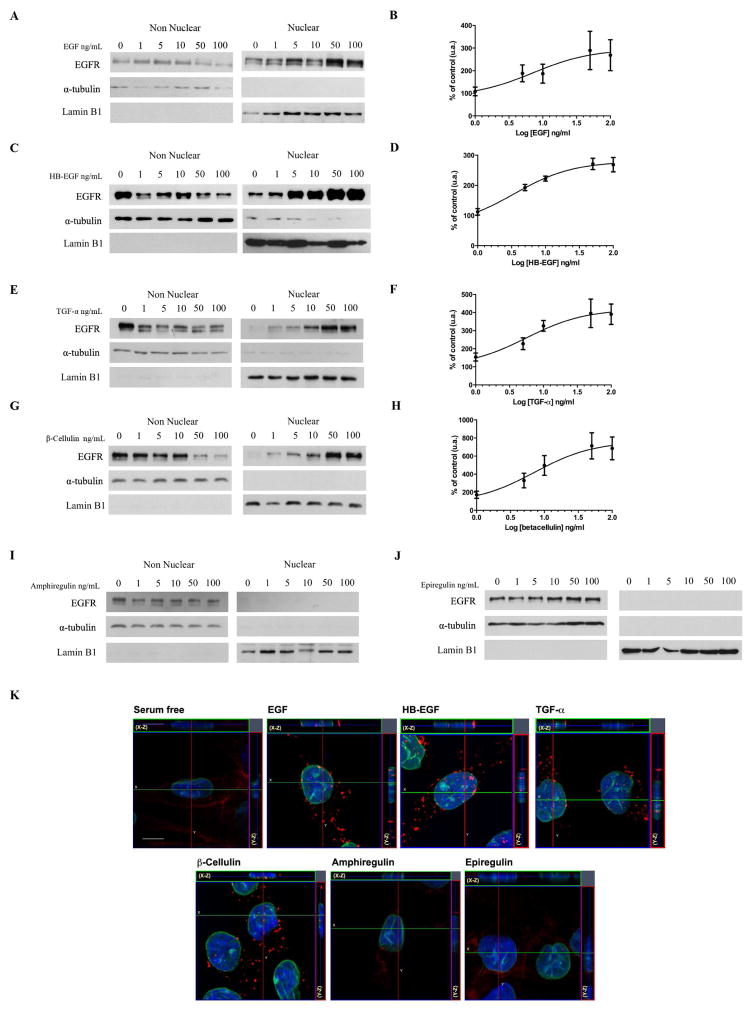
Figure 1. EGF, HB-EGF, TGF-α, β-Cellulin induce EGFR nuclear translocation in a dose-dependent manner in SkHep-1 cells while amphiregulin and epiregulin do not.
A, C, E, G, I, J, Western blot analysis of total EGFR in non-nuclear and nuclear fractions isolated from resting (0) or EGFR ligands stimulated cells (1, 5,10, 50 and 100 ng/ml) for 10 minutes. α-tubulin and Lamin B1 were used as purity control for nuclear and non-nuclear fractions, respectively. Bands corresponding to EGFR in the nuclear fractions are detected in EGF, HB-EGF, TGF-α, β-Cellulin-stimulated groups (A, C, E, G). EGFR bands are not observed in amphiregulin and epiregulin nuclear fractions (I, J). EGFR Blots are representative of what was observed in three separate experiments. B, D, F, H, EC50 curves from densitometrics analysis confirms the dose-dependent EGFR nuclear translocation upon EGF, HB-EGF, TGF-α, β-Cellulin stimulation. The nuclear detection of EGFR was expressed as percent of EGFR expression in resting cells. Line through EGFR expression is the nonlinear regression fit with Hill equation of ligand dose response. Data are represented as mean ± S.E (N=3). K, confocal images of non-stimulated SkHep-1 cells (serum free) and upon 10 min EGFR ligands stimulation (100ng/ml). Lamin B1, the nuclear membrane marker is showed in green, EGFR in red and the nuclear staining hoechst in blue. Serial optical sections were collected for three-dimensional reconstruction; x–z sections are shown at the top, and y-z sections are shown at the right of each image (bar = 10 μm).

