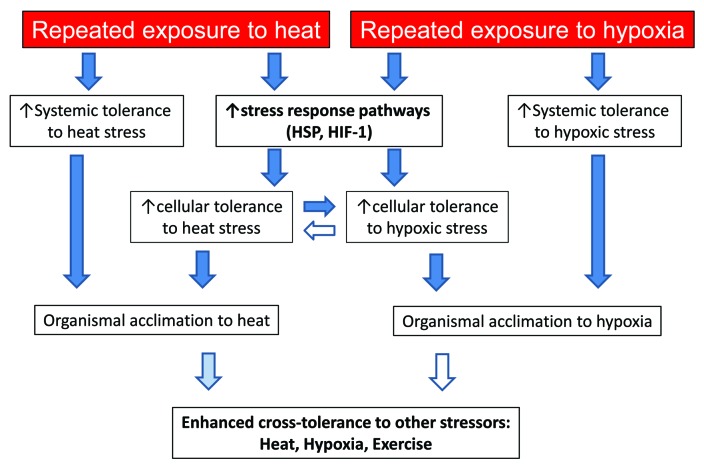
Figure 1. The transition between exposure to heat or hypoxic stress, cellular stress response, systemic response, and acclimation/enhanced tolerance. Dark blue arrows indicate clear experimental evidence to support this relationship. Pale blue arrows indicate emerging evidence to support, while unfilled arrows indicate a possible relationship that has not yet been experimentally examined.

An official website of the United States government
Here's how you know
Official websites use .gov
A
.gov website belongs to an official
government organization in the United States.
Secure .gov websites use HTTPS
A lock (
) or https:// means you've safely
connected to the .gov website. Share sensitive
information only on official, secure websites.
