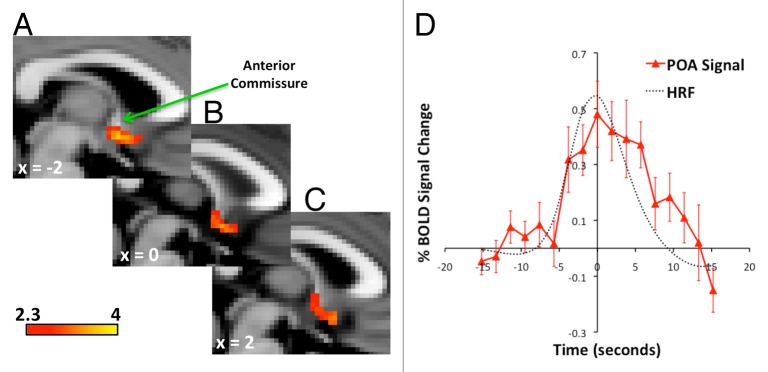
Figure 1. (A) A cluster of sweating activation occurred in a region encompassing the POA. The peak of the cluster was 2mm into the left hemisphere immediately inferior to the anterior margin of the anterior commissure. (B) The POA cluster of sweating activation extended across the midline, and (C) into the right hemisphere. (D) The signals were extracted from the POA cluster and divided into 32.2 s periods centered around peaks of sweating events. The sweating divisions were averaged for each participant and then a grand mean was calculated for the sample. The grand mean time course shows the increases predicted by a similar average of hemodynamic response functions (HRF). Activation Pcorrected < 0.05. Positions of slices labeled according to convention where +ve x = distance in mm to right of midline, x = 0 is at midline, and –ve x = distance in mm to left of midline.

An official website of the United States government
Here's how you know
Official websites use .gov
A
.gov website belongs to an official
government organization in the United States.
Secure .gov websites use HTTPS
A lock (
) or https:// means you've safely
connected to the .gov website. Share sensitive
information only on official, secure websites.
