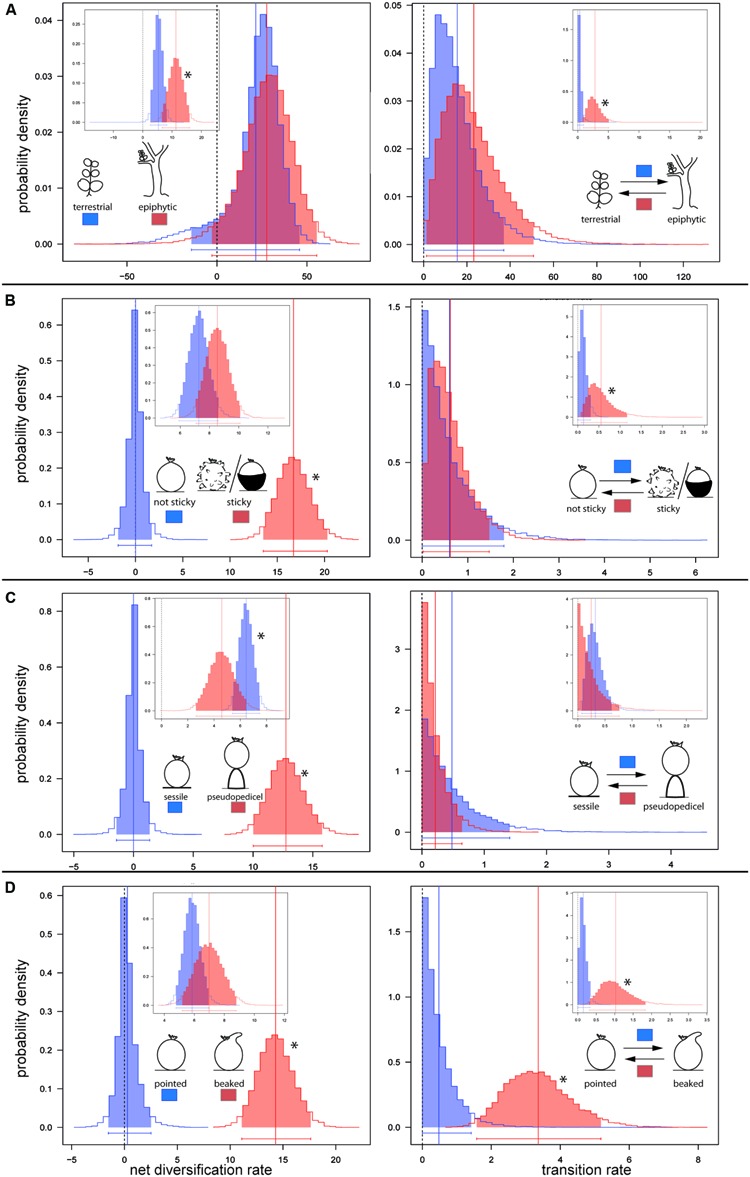
FIGURE 3.

Posterior distributions of diversification rate (left) and character transition rate (right). Rates were estimated by BiSSE MCMC under the 12-parameter full BiSSE split model. Main profile plots show foreground parameter estimates. Inbox plots show respective estimations for the background phylogeny. Rate estimations are shown for (A) terrestrial and epiphytic Peperomia lineages; (B) for lineages lacking and those possessing sticky fruits; (C) for lineages without pseudopedicel and with pseudopedicel formation, and (D) for lineages showing pointed fruits and those with beaked fruits. ∗ marks significantly higher rates for one state over another.
