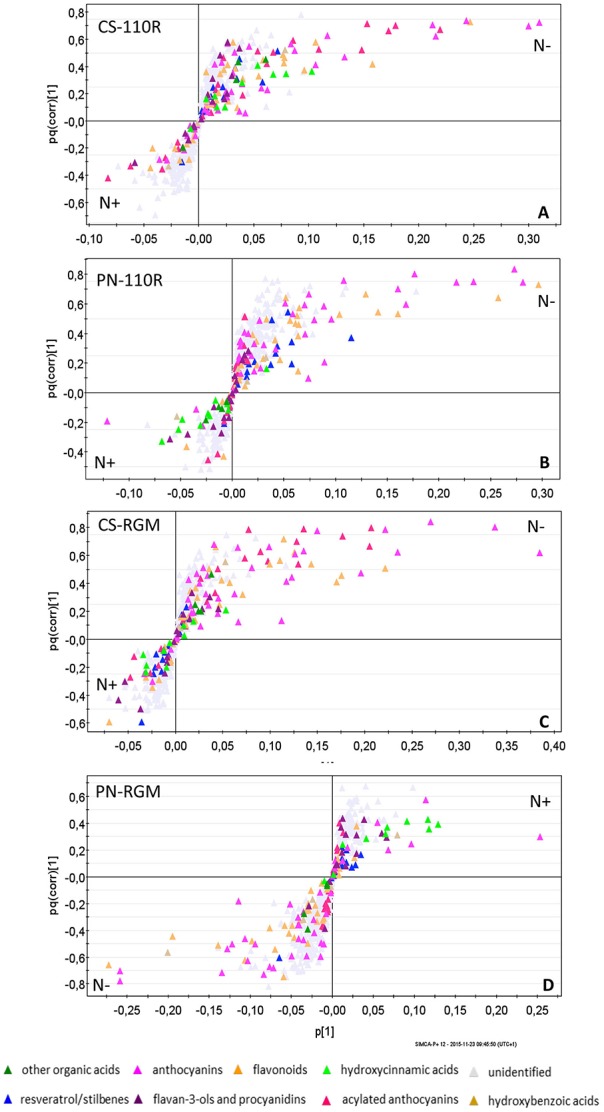
Figure 3.

O2PLS-DA loading plot showing the CS-110R, PN-110R, CS-RGM, PN-RGM samples in two nitrogen nutrition status (N– = 0.8 mM; N+ = 3.6 mM) clustered according to their skin grape berry metabolites. CS, Cabernet-Sauvignon; PN, Pinot noir; 110R, 110R rootstock; RGM, RGM rootstock.
