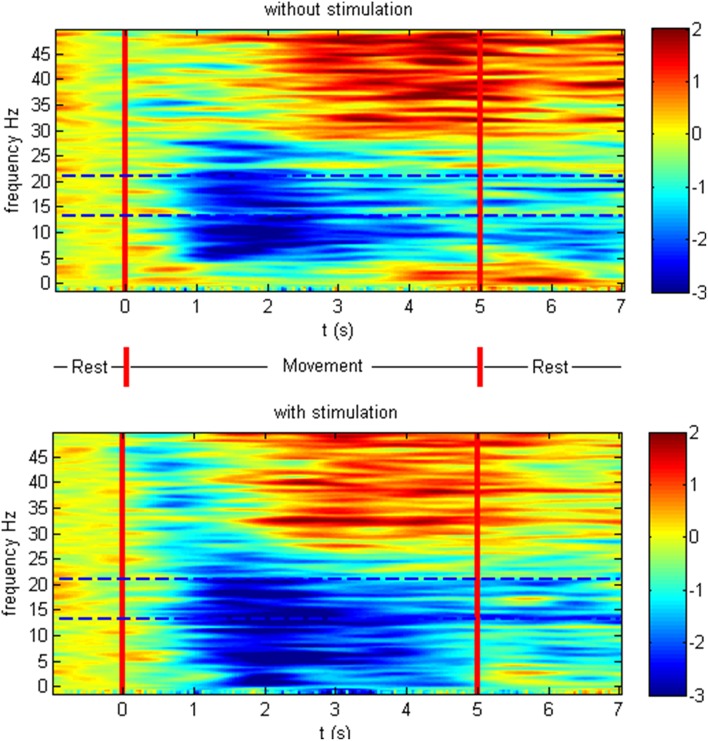
Figure 5.
Event-related spectral perturbation in dB. Time-frequency plot of cortical activity as the average at CF4, C4 CP4 for the different conditions on the group level. The intervention modulated the movement-related brain activity by prolonged desynchronization in the feedback frequency band (16–22 Hz) indicated with dotted lines as well as by inducing additional broadband ERD throughout the task period in the low beta, delta, and gamma band.

