
FIGURE 11.
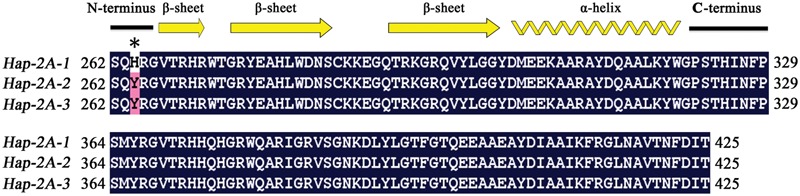
Comparison of AP2 domain amino acid sequences in three haplotypes of TaPARG-2A. Secondary structural units are shown at the top. Common amino acid residues are shown in black background. Numbers indicate amino acid position. Asterisk indicates variation site.