
FIGURE 3.
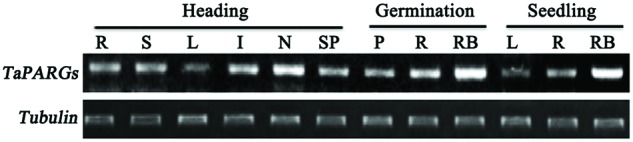
Tissue expression patterns of TaPARGs in wheat. Expression patterns at different developmental stages were detected by semi-quantitative RT-PCR. R, root; S, leaf sheath; L, leaf blade; I, internode; N, node; SP, spike; P, plumule; RB, root base.