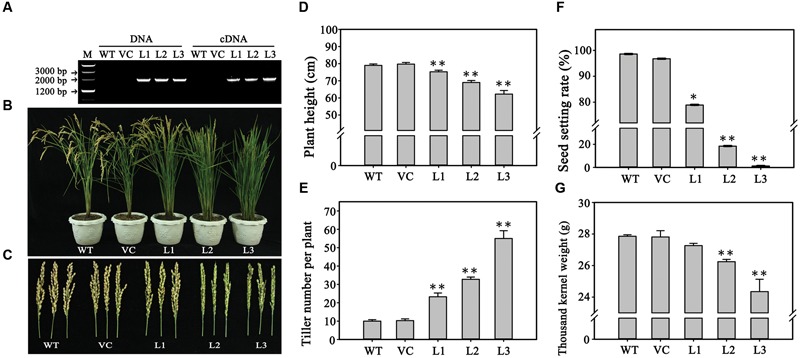
FIGURE 4.

Phenotypes of rice plants overexpressing TaPARG-2D. (A) Gene amplification and transcriptional expression in three transgenic rice lines. Morphology of three transgenic lines and two controls: plants (B) and main panicles (C). Comparison of agronomic traits in transgenic and control plants for plant height (D), tiller number per plant (E), seed setting rate (F) and 1,000 kernel weight (G). WT, wild type; VC, plants transformed with the empty pCUBi1390 vector; L1, L2, and L3, transgenic lines. Error bars denote 1 SE. ∗∗P < 0.05, ∗∗P < 0.01, respectively.
