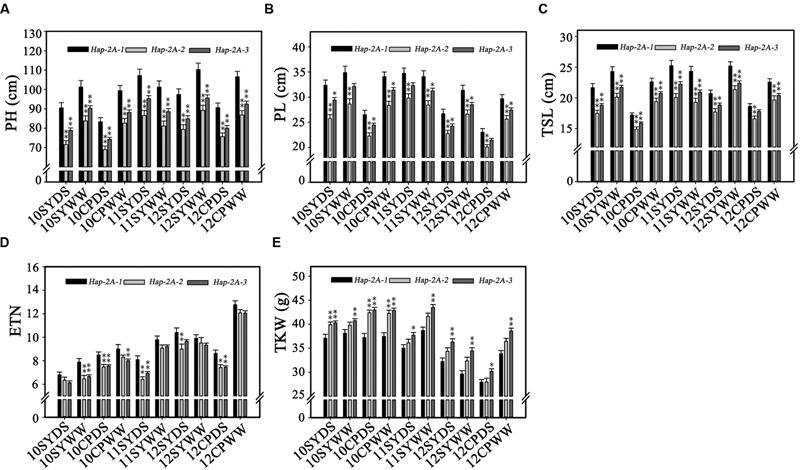
FIGURE 7.

Phenotypic comparisons of three TaPARG-2A haplotypes in 10 environments. Traits are PH (A), PL (B), TSL (C), ETN (D), and TKW (E). ∗P < 0.05, ∗∗P < 0.01, respectively. Error bars denote 1 SE. See footnote to Table 1 for abbreviations.

Phenotypic comparisons of three TaPARG-2A haplotypes in 10 environments. Traits are PH (A), PL (B), TSL (C), ETN (D), and TKW (E). ∗P < 0.05, ∗∗P < 0.01, respectively. Error bars denote 1 SE. See footnote to Table 1 for abbreviations.