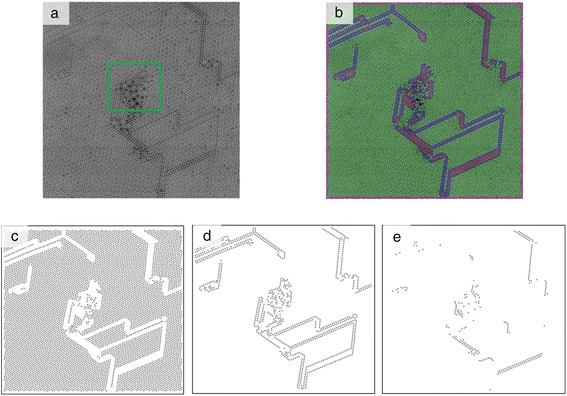
Figure 11.

K-means clustering results for four clusters on the STEM-HAADF image of the Mo-V-Sb-Ta oxide two-phase catalyst. (a) Raw STEM image. (b) K-means result for four clusters based on the length to the six nearest neighbors distance metric. (c) Sole cluster 1. (d) Sole cluster 2. (e) Sole cluster 3.
