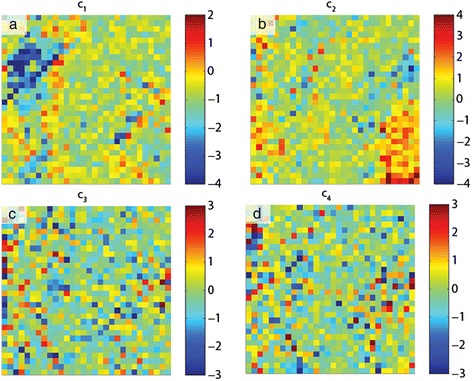
Figure 6.

ICA of band excitation piezoresponse force spectroscopy (BEPS) data. (a) Mixing coefficient maps associated with the first independent components in Figure 5. (b) Mixing coefficient maps associated with the second independent components in Figure 5. (c) Mixing coefficient maps associated with the third independent components in Figure 5. (d) Mixing coefficient maps associated with the fourth independent components in Figure 5.
