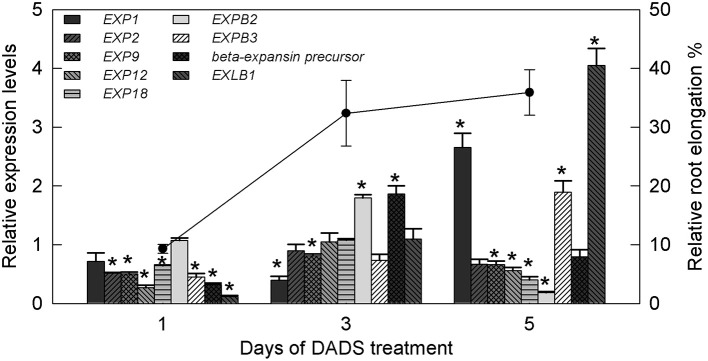
Figure 7.
Relative transcript levels of expansin genes in tomato root and relative root elongation after treatment with 0.41 mM DADS. Histogram shows the relative transcript level of expansin genes. A value of 1 means the expression level is equal to that in the control. *Significant differences according to the T-test (P = 0.05), N = 3. Line graph represents relative root elongation (% greater than the water control).

