
Figure 2.
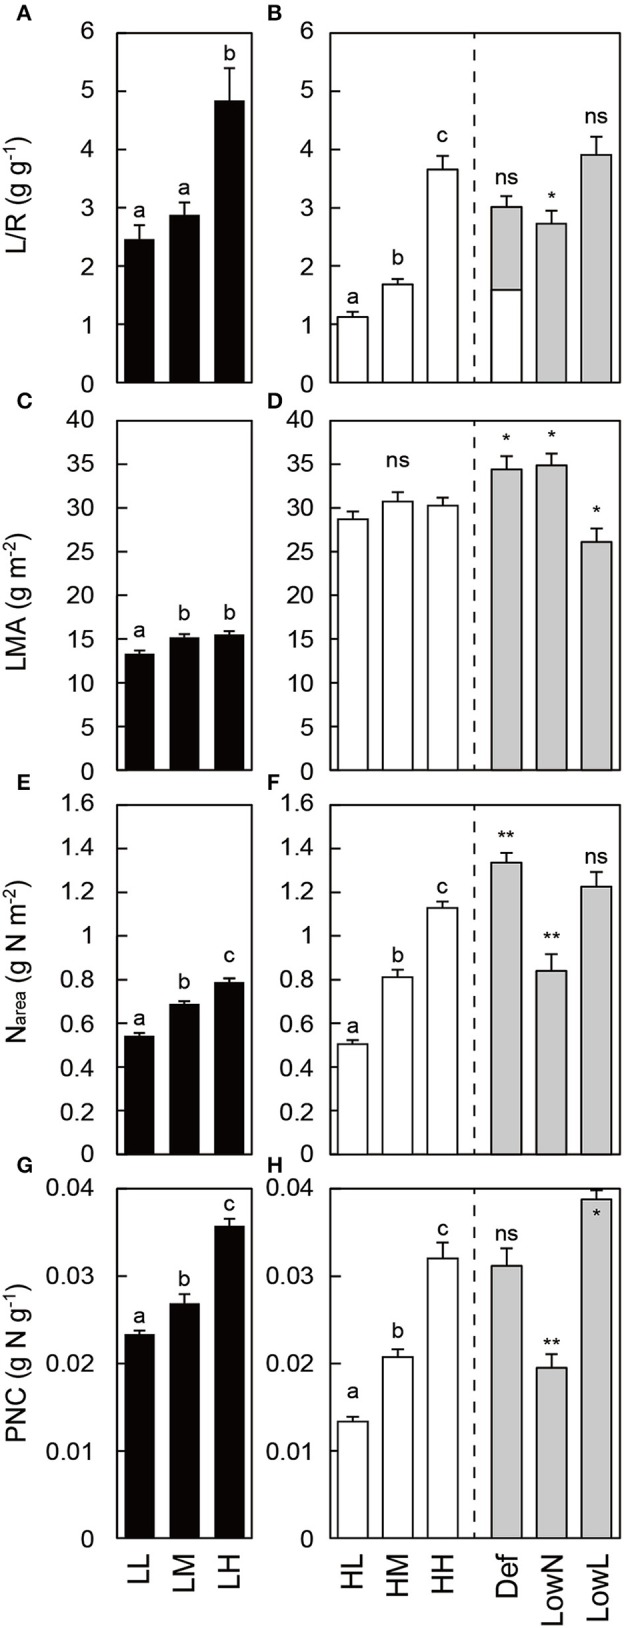
Morphological traits and nitrogen content in Polygonum cuspidatum grown under low light (A,C,E,G) and high light conditions (B,D,F,H). See text for abbreviations. For LMA and Narea, values obtained from the all leaves are presented for LL, LM, LH, HL, and HM, and weighted mean values of all the leaves are resented for HH, Def, LowN, and LowL. The white bar inside the value of L/R in Def (B) represents the value just after the defoliation treatment. Letters indicate significant differences among nitrogen treatments in low light (LL, LM, and LH) and high light (HL, HM, and HH; one-way ANOVA followed by, P < 0.05, Tukey's test, P < 0.05). Asterisks indicate significant differences in Def, LowN, and LowL compared with HH (Student's t-test, *P < 0.05; **P < 0.01). Values are means + SE (n = 4–8).