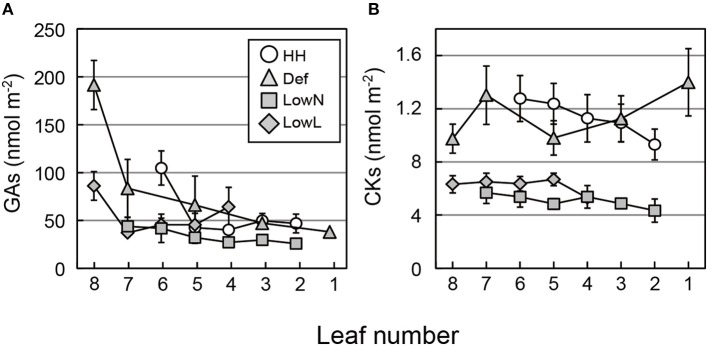
Figure 6.
Endogenous levels of GAs (A) and CKs (B) in each leaf of Polygonum cuspidatum. See text for abbreviations. Open circles, gray triangles, gray rectangles, and gray diamonds denote HH, Def, LowN, and LowL, respectively. Numbers on the x-axes denote the leaf position (see text for details). Values are means ± SE (n = 4–8).

