Figure 8.

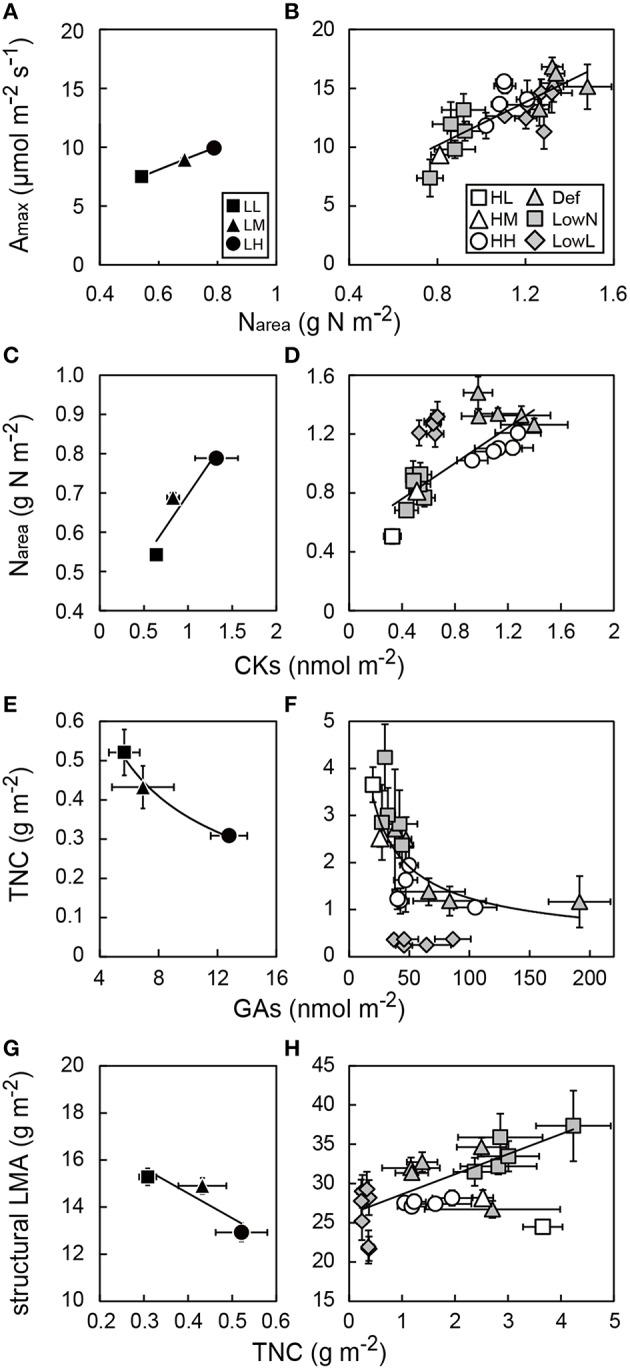
Relationships between maximum photosynthetic rate (Amax) and leaf nitrogen content per area (Narea), between Narea and endogenous levels of CKs in leaves, between total non-structural carbohydrates (TNC) and endogenous levels of GAs, and between structural leaf mass per area (sLMA) and TNC in low light (A,C,E,G) and high light conditions (B,F,F,H) in Polygonum cuspidatum. See text for abbreviations. For GAs, Narea TNC, and structural LMA in leaves, values obtained from the all leaves are presented for LL, LM, LH, HL, and HM, and those from each leaf are presented for HH, Def, LowN, and LowL. Closed rectangles, triangles, and circles denote LL, LM, and LH, and open rectangles, triangles, and circles denote HL, HM, and HH, respectively. Gray triangles, gray rectangles, and gray diamonds denote Def, LowN, and LowL, respectively. Solid lines and curves represent regression lines and curves for LL, LM, and LH (A,C,E,G) and HL, HM, HH, Def, and LowN (B,F,F,H) where the value of LowL and those of HL, HM, and HH were excluded in (D,F) and (H), respectively; (A) R2 = 0.81, (B) R2 = 0.60, (C) R2 = 0.88, (D) R2 = 0.69, (E) R2 = 0.99, (F) R2 = 0.58, (G) R2 = 0.80, (H) R2 = 0.54. Values are means ± SE (n = 4–8).
