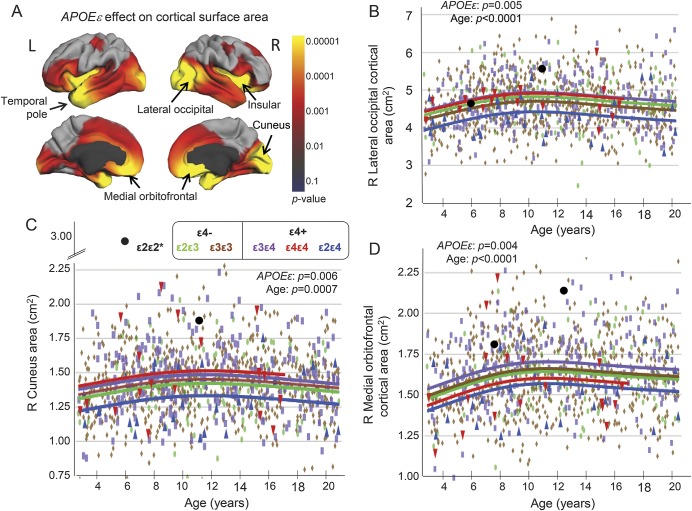
Figure 2. APOE ε genotypic variations on cortical areas.
(A) The p value maps using the vertex model reveal significant APOE ε effects (red and yellow) on cortical surfaces of the insular cortex, the temporal poles, as well as the 3 right hemisphere regions (lateral occipital, medial orbitofrontal, and cuneus) shown to be different across genotypes on the region-of-interest model (see B–D). The ε2ε4 group showed the smallest cortical areas across the age range in the right lateral occipital cortex (B), right cuneus (C), and right medial orbitofrontal cortex (D). Post hoc analysis shows that, relative to the reference ε3ε3 group (brown), the ε2ε4 group (blue) had significantly smaller right medial orbitofrontal cortical areas (p = 0.006) and smaller right cuneus areas (p = 0.002), while the ε3ε4 group (purple) had larger lateral occipital (p = 0.016) and medial orbitofrontal cortical areas (p = 0.006). The ε4ε4 group (red) also had the largest areas among all groups in the right cuneus (ε4ε4 > ε2ε4, p = 0.07) and right lateral occipital area (ε4ε4 > ε2ε4, p = 0.04). The children with ε2ε2 (black) had relatively large cortical areas in the cuneus and right medial orbitofrontal regions, largest in the younger ε2ε2 child. See also table e-3 for additional results. *Data for the ε2ε2 children are not included in the group analyses.

