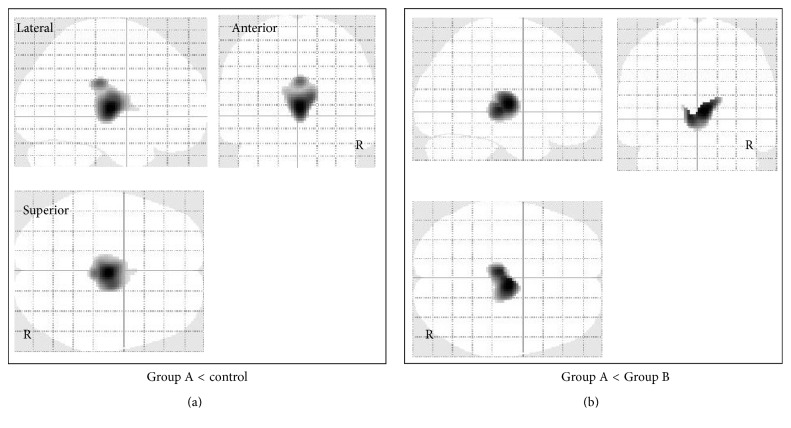
Figure 2.
Voxel-based analysis of glucose metabolism data obtained by FDG-PET imaging in all patients with mild/moderate TBI. SPM in orthogonal maximum-intensity projections showing voxels with significantly lower FDG uptake (shaded areas, FWE-corrected p < 0.05) in Group A versus control group (a) and in Group A versus Group B (b). The shading intensity shows the overlap of hypometabolic regions from three directions (lateral, anterior, and superior). Brain metabolism was significantly lower in the cingulate gyrus and medial thalamus in Group A compared with the control group and lower in the medial thalamus in Group A compared with Group B.

