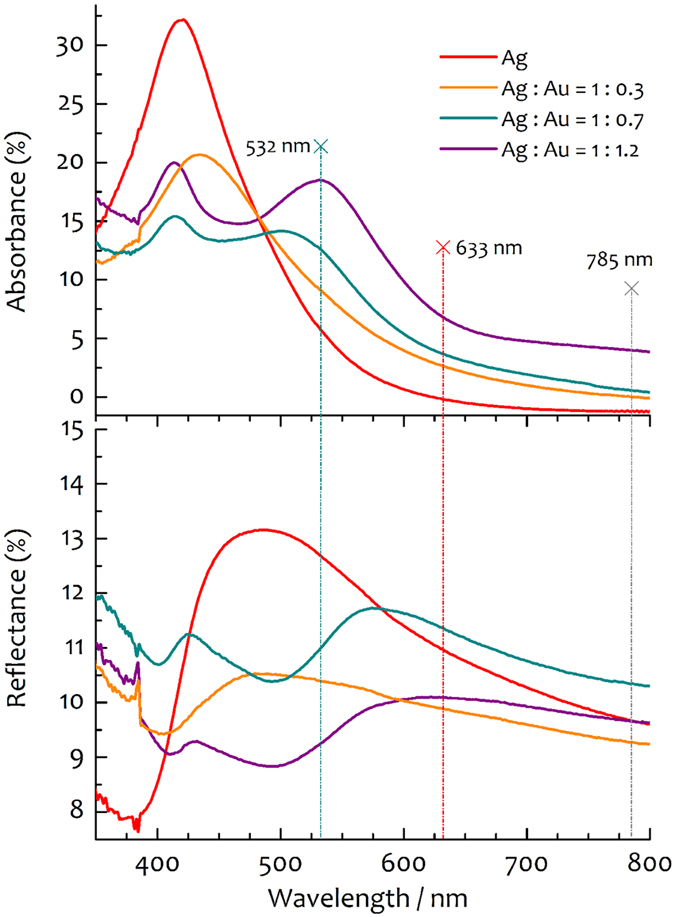
Figure 2. UV-vis characterization.

Absorbance and reflectance spectra of nanoislands obtained from templates of BCP micelles loaded with clusters of AgNPs and bimetallic Ag@AuNPs with amount ratios Ag: Au as indicated in the legend (from EDX, Fig. S1). UV-vis curves were acquired in transmission (extinction) and reflection (scattering) on films spin-coated on glass coverslips, hence determining the absorbance contribution. For AgNPs, a large scattering contribution is measured and peaked at 500 nm against absorption peaked at 420 nm (red lines). For Ag@AuNPs, there is a significant variation in both absorption and scattering coefficients. The main scattering band, initially peaked at 480 nm (yellow line), progressively moves to 575 nm (cyan line) and then to ~630 nm (violet line) extending in the infrared. These bands are ascribed to additional clustering of AuNPs mixed with AgNP aggregates.
