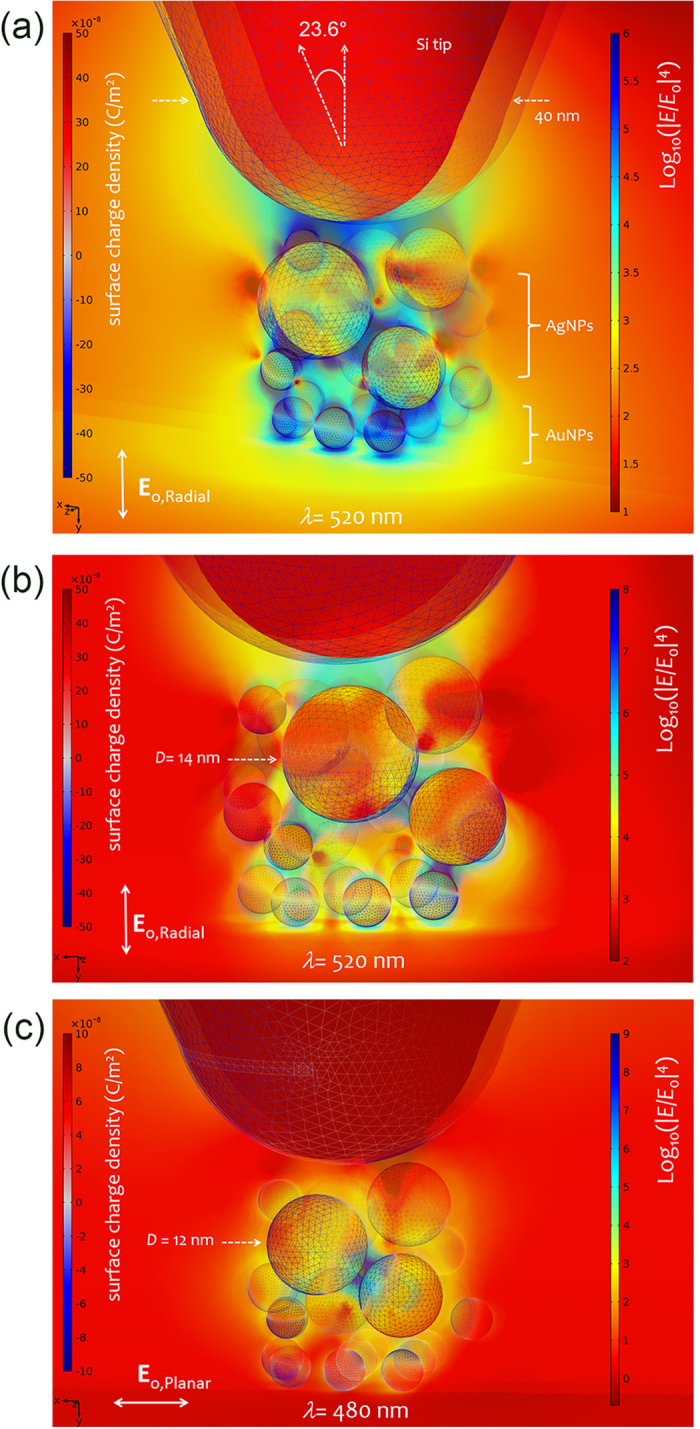
Figure 4. Numerical simulations of representative apical clusters at the tip apex of our TERS probes.

(a) Enhancement factor spatial distribution approximated as the four power of the norm E of the scattered electric field normalized to the incident radially polarized wave field, of amplitude Eo at λ = 520 nm (bottom illumination); surrounding medium index n = 1.4. The tomographic representation of the field amplification is rendered by means of 3 overlaid transparent cut planes at z = −7, 0, 8 nm and a y-planar cut 0.5 nm below AuNPs. Colormap on the left represents the surface charge density calculated on wireframed nanoparticles and tip. The enhancement factor (logscale) on the right is saturated at 106: regions of such level fill and surround the apical cluster. (b) Same as in (a), with nonsaturated colormap of enhancement factor and different angle of view. Please note the chain coupling from the center to the peripherical NPs that transmits local field amplification to the surface of AuNPs. (c) Enhancement factor distribution as in (a), but for a slightly different configuration of NPs (the bigger is 12 nm) for excitation at 480 nm, with plane wave polarization along the x-axis. See text for details.
