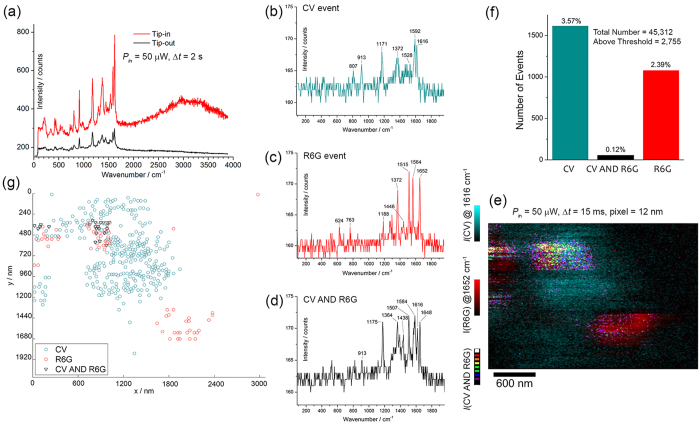
Figure 6. Bi-analyte TERS experiment.
(a) Tip-in (TERS) and tip-out (SERS) spectra onto a transparent SERS substrate covered with CV and R6G molecules (with incident radial polarization). The SERS and gap-mode TERS spectra point out only the CV component into a fixed position. Panels (b–d) show examples of typical TERS spectra of CV, R6G and mixed CV with R6G (indicated as CV AND R6G) acquired in consecutive positions of the SERS substrate. (e) Normalized integrated intensity maps, respectively, of the main bands of CV (blue color) and R6G (red color) with overlaid colormaps and coincidence map of the product of the intensities of CV and R6G (dark level = 0, white level = 1). The map was taken with 256 × 170 pixels over an area of 3 μm × 2 μm, with integration time Δt = 15 ms (per pixel). (f) Histogram of the counts of single molecule events of CV, R6G and mixed events. The low coincidence rate points out a single-molecule statistics. (g) Centroidal map of the regions of connected pixels in which one spectral species (CV, R6G or mixed) appear consecutively detected along the scan in (f).

