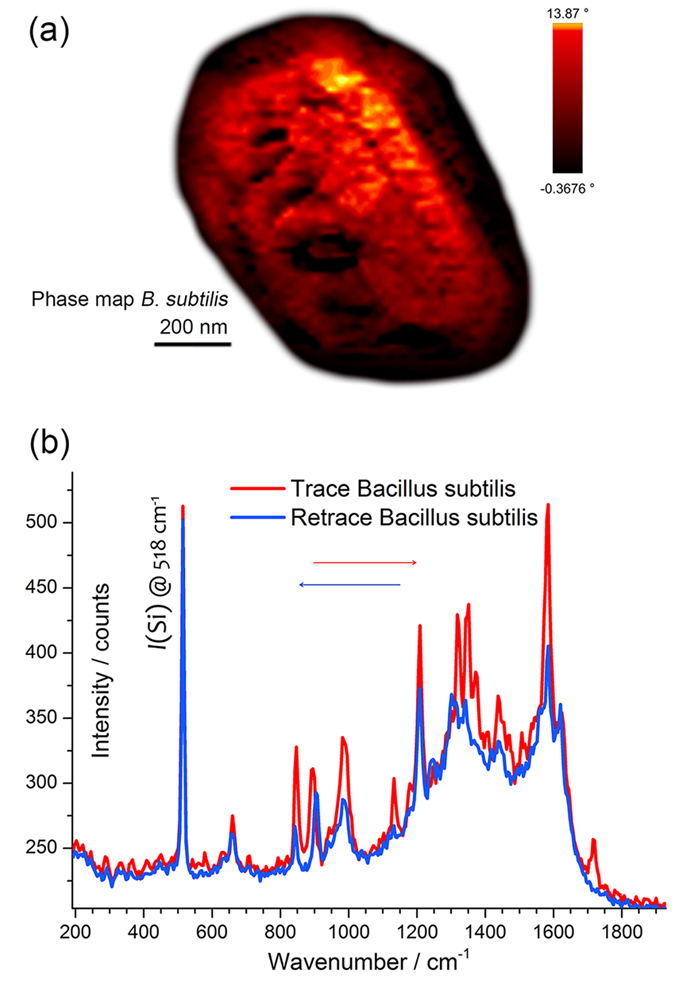
Figure 7. TERS characterization on a thick biosample: spore of Bacillus subtilis.

(a) Phase map of B. subtilis spore. (b) Tip-in, trace and retrace TERS spectra onto the B. subtilis spore. See text for details.

(a) Phase map of B. subtilis spore. (b) Tip-in, trace and retrace TERS spectra onto the B. subtilis spore. See text for details.