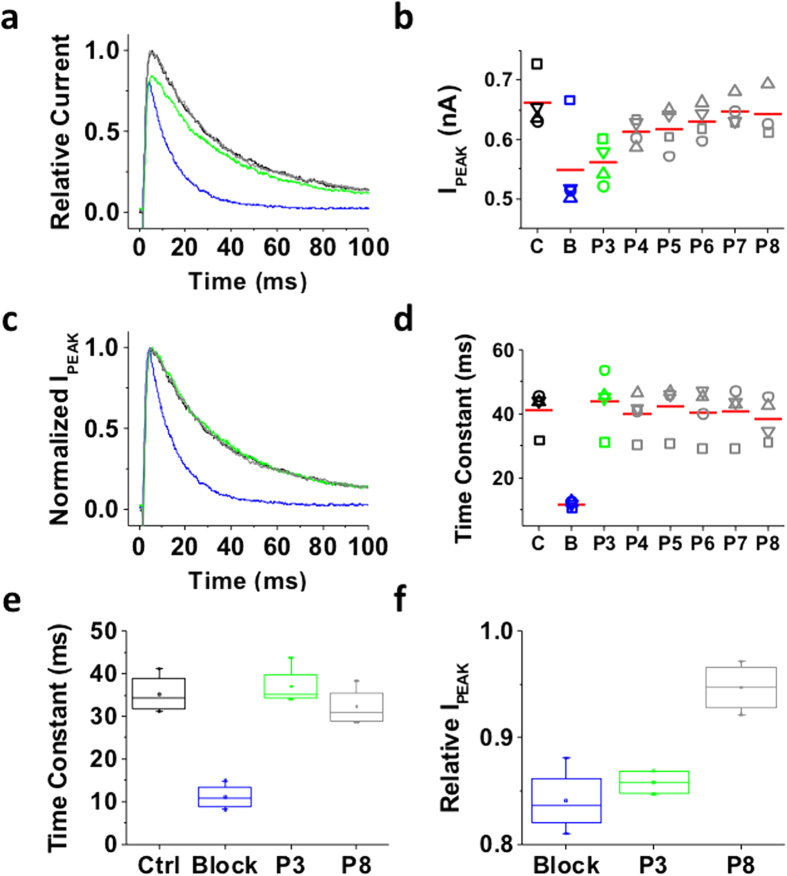
Figure 5. Lengthening the P2–P3 interval does not change block-trap-escape pattern produced by inactivation of the ternary Kv4.1 channel complex.
(a) Inside-out macropatch outward currents evoked by a step to +50 mV from a holding voltage of −100 mV. The overlaid traces depict the current profile before (black), during (blue) and after (green and gray) exposure of the intracellular side of the channel to 100 μM bTBuA. The exposure to the QA ion began before the step depolarization and was terminated after macroscopic inactivation reached steady-state (Fig. 2). Note that no exposure was allowed during the repolarizing step that closes the channels. (b) Magnitude of peak currents in four consecutive iterations of the experiment described above. Pulses P1 (C, Control), P2 (B, Block) and P3–P8 evoke the currents as explained in Fig. 2. Critically, the interval between P2 and P3 was prolonged from 5 s (Fig. 4) to 40 s to eliminate the possibility of apparent QA ion trapping resulting from lack of recovery from inactivation at P3. (c) Scaled and normalized currents from panel (a). (d) Time constants of decay from the currents evoked by the test pulses as explained above for panel (a). (e) Box plots of the time constants of current decay during blockade by bTbuA (blue box), after washout (green box) and from the currents evoked by P8 (N = 5 patches; 4–12 iterations each). (f) Box plots of the relative peak current amplitudes during blockade by bTbuA (blue box), after washout (green box) and from the currents evoked by P8 (N = 5 patches; 4–12 iterations each). On average, the peaks of currents evoked by P3 and P8 are significantly different (Kruskal-Wallis, p < 0.001).

