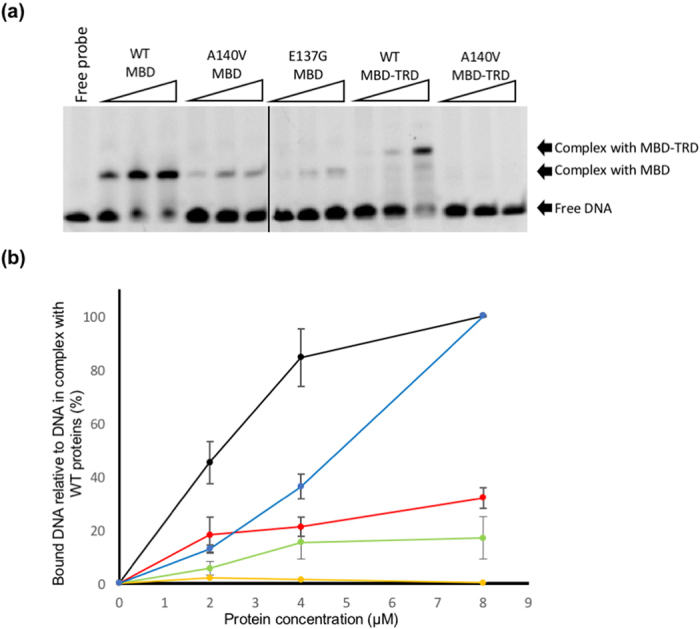
Figure 2. Electrophoretic mobility shift assay.

(a) The electrophoretic mobility shift assay (EMSA) was performed with the methylated DNA in the presence of wild-type or mutant forms of the MeCP2 MBD and MBD-TRD domains. Each MeCP2 construct was analysed at three different protein concentrations (2 μM, 4 μM, 8 μM). The positions of the methylated DNA, free and in complex with the MBD and MBD-TRD domains, are indicated by arrows. (b) A plot of the fraction of the band intensity of the DNA-protein complex at protein concentrations of 2 μM, 4 μM and 8 μM as measured by the Quantity One software. Standard deviations (represented by vertical bars) were calculated from the measured intensities from three separate gels. The values of the band intensity were compared to the intensity of the complex of wild-type MBD or MBD-TRD and the methylated DNA, which was taken as 100%. Plots represent wild-type MBD (Black), MBDA140V (Red), MBDE137G (Green), wild-type MBD-TRD (Blue) and MBDA140V-TRD (yellow).
