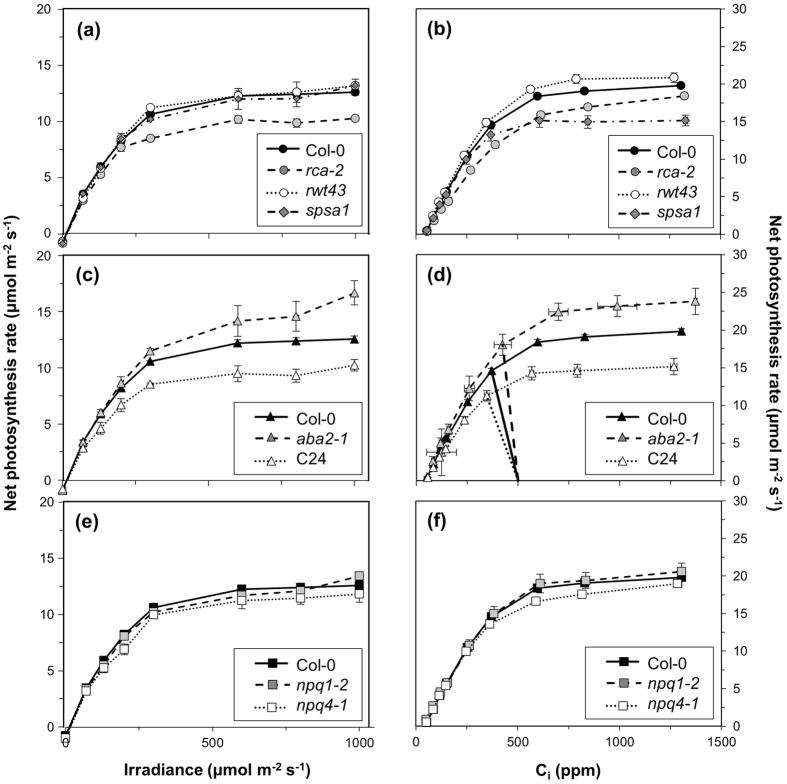
Figure 1.
Irradiance and CO2 response of net photosynthesis rates in rca-2, rwt43 and spsa1 (a,b), aba2-1 and C24 (c,d) and npq1-2 and npq4-1 (e,f). Col-0 is included in each panel for ease of comparison. In (d), supply lines38 between Ca = 500 and the corresponding Ci response curve of An are shown to emphasize stomatal effects of aba2-1, C24 and Col-0 on Ci. Averages ± SEM, n = 5–15.

