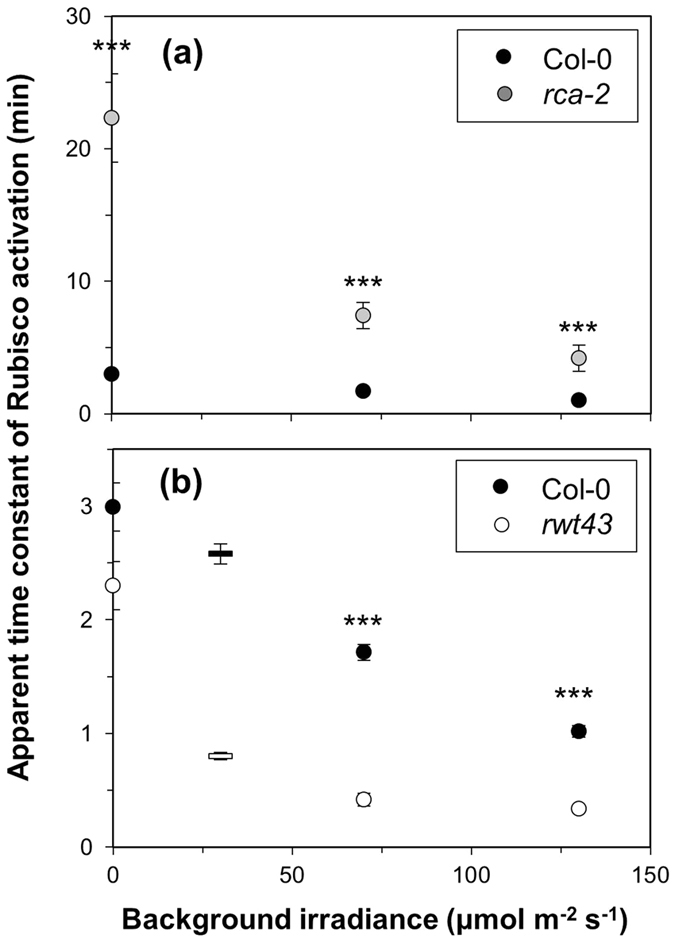
Figure 5.

Apparent time constant of Rubisco activation in rca-2 (a) and rwt43 (b), compared to Col-0. Note the different scales of Y-axes in (a,b). Averages ± SEM, n = 5–15. Bars in (b) at 30 μmol m−2 s−1 background irradiance included from Carmo-Silva and Salvucci42. Stars denote significance levels of single genotypes compared to Col-0: ***P < 0.001.
