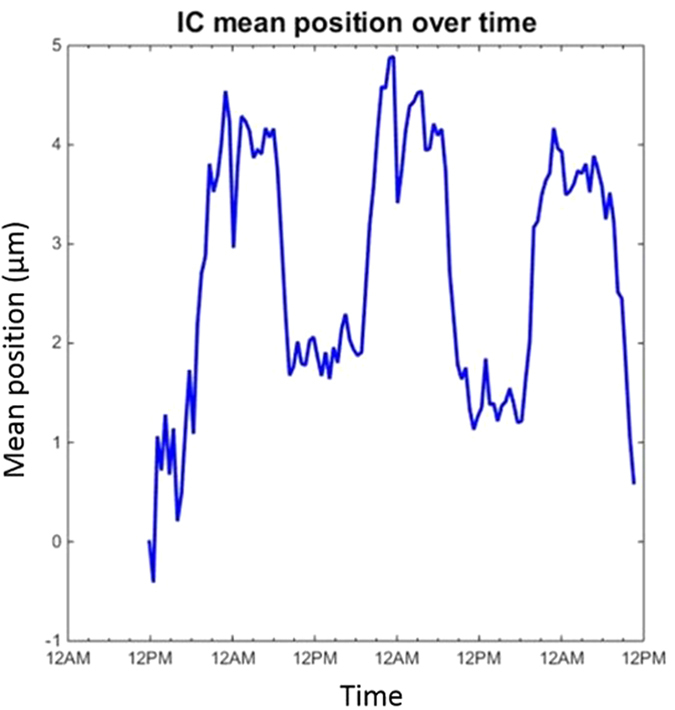
Figure 2. The position of the mean of the illumination curve (IC) as a function of time, taken from experimental data.

The illumination curve analysis considered an area of 50 × 50 pixels in the centre of the field of view.

The illumination curve analysis considered an area of 50 × 50 pixels in the centre of the field of view.