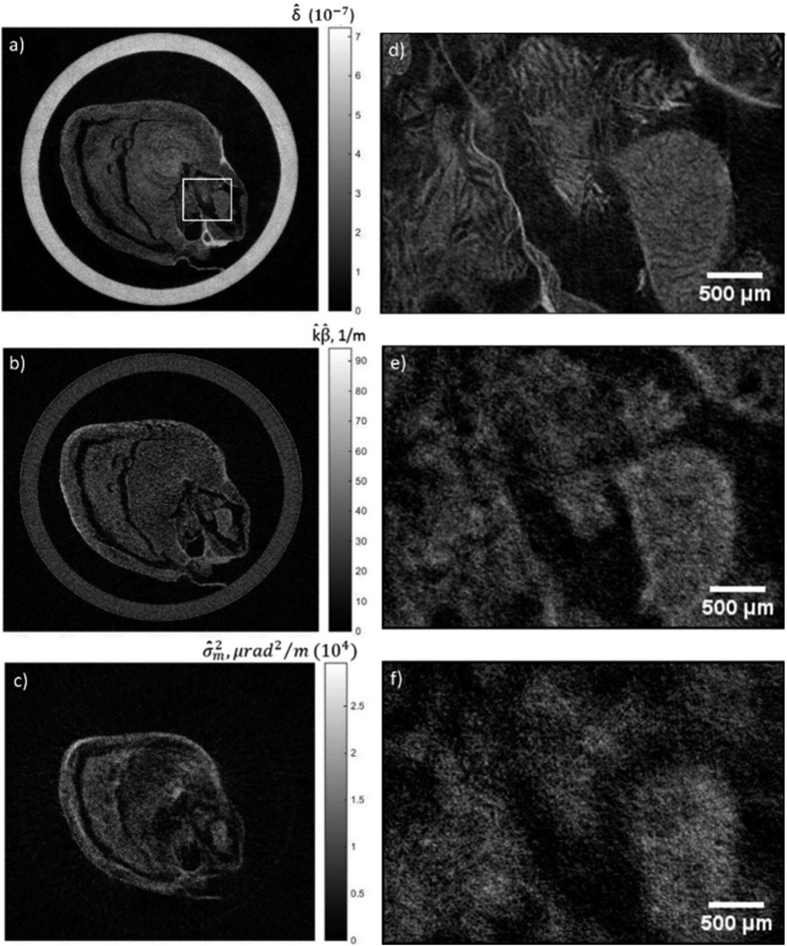
Figure 5.
CT reconstructed slices of the phase (a), absorption (b) and scattering distribution (c) of a rat’s heart, processed with the modified local phase retrieval. As these data were acquired with a polychromatic spectrum, the reconstructed maps refer to sample properties estimated at effective energies, notified by the hat symbol. (d–f) show their corresponding magnified views of the region in the rectangle in (a).

