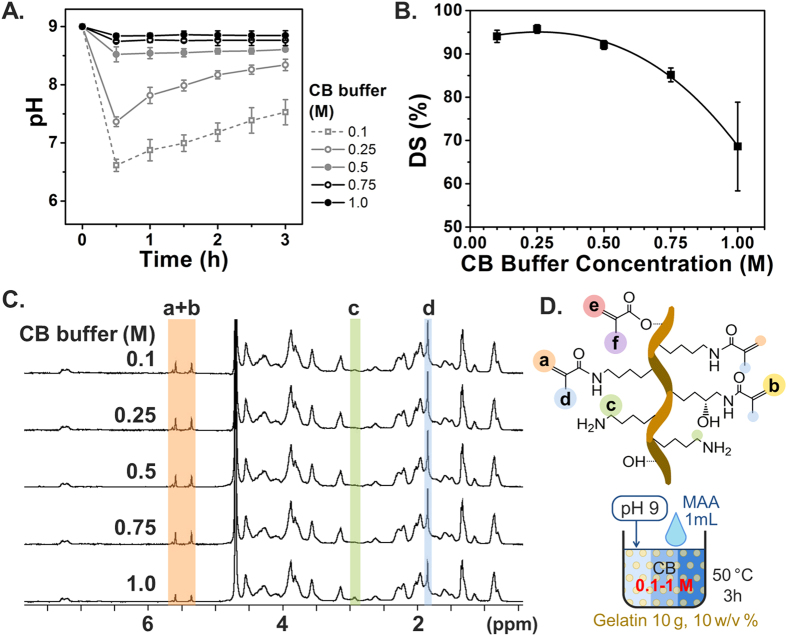
Figure 2. Effect of different CB molarities on DS of GelMA synthesis.
Error bars indicate the relative standard deviations of three or more different samples (n ≥ 3). (A) pH transition kinetics during the reaction. (B) DS versus CB molarity. DS was obtained from TNBS assay. A higher CB buffer concentration kept pH more steady but led to a lower DS. The highest DS was obtained at 0.25 M CB. (C) 1H NMR verification. Peaks correspond to acrylic protons (2H) of methacrylamide grafts of lysine groups (a) and those of hydroxyl lysine groups (b), methylene protons (2H) of unreacted lysine groups (c), methyl protons (3H) of methacrylamide grafts (d), acrylic protons (2H) of methacrylated grafts of hydroxyl groups (e), and methyl protons (3H) of methacrylated grafts of hydroxyl groups (f). (D) Schematic illustration of GelMA corresponding to 1H NMR peaks.

