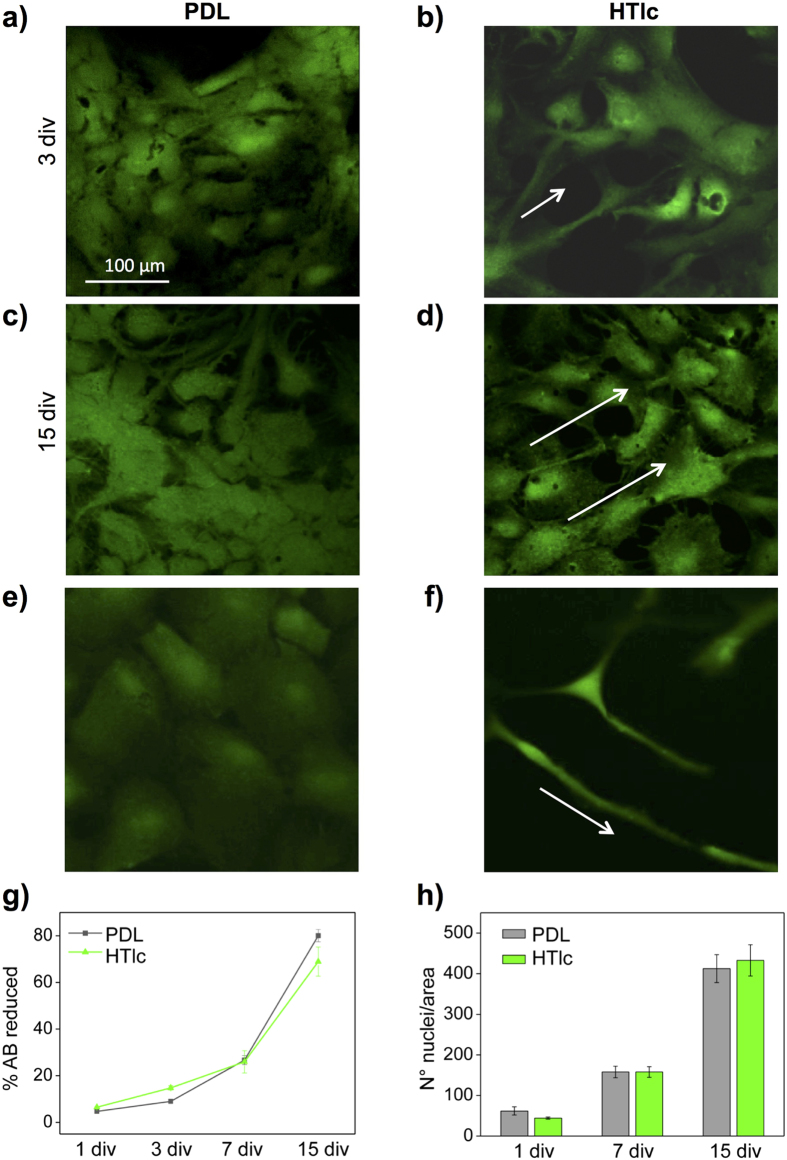
Figure 3. Viability and morphology of astrocytes on PDL and HTlc films.
(a–f) Single plane confocal images of astrocytes stained for FDA, representing viable cells plated on PDL (a,c) and on HTlc (b,d) captured after 3 div (a,b), and 15 div (c,d). (e,f) Low density plated astrocytes captured after 7 div; note differentiated astrocytes plated on HTlc (g) Time course of astrocyte viability on PDL and HTLc film, investigated by AB assay at different time points. Data are plotted as the averaged percentages of reduced AB ± Standard Error (SE) versus div. (h) Histogram plot reporting the averages of astrocyte nuclei number, counted on images of cells grown on PDL (gray bars) and on HTlc films (green bars). (p > 0.05, independent t test).

