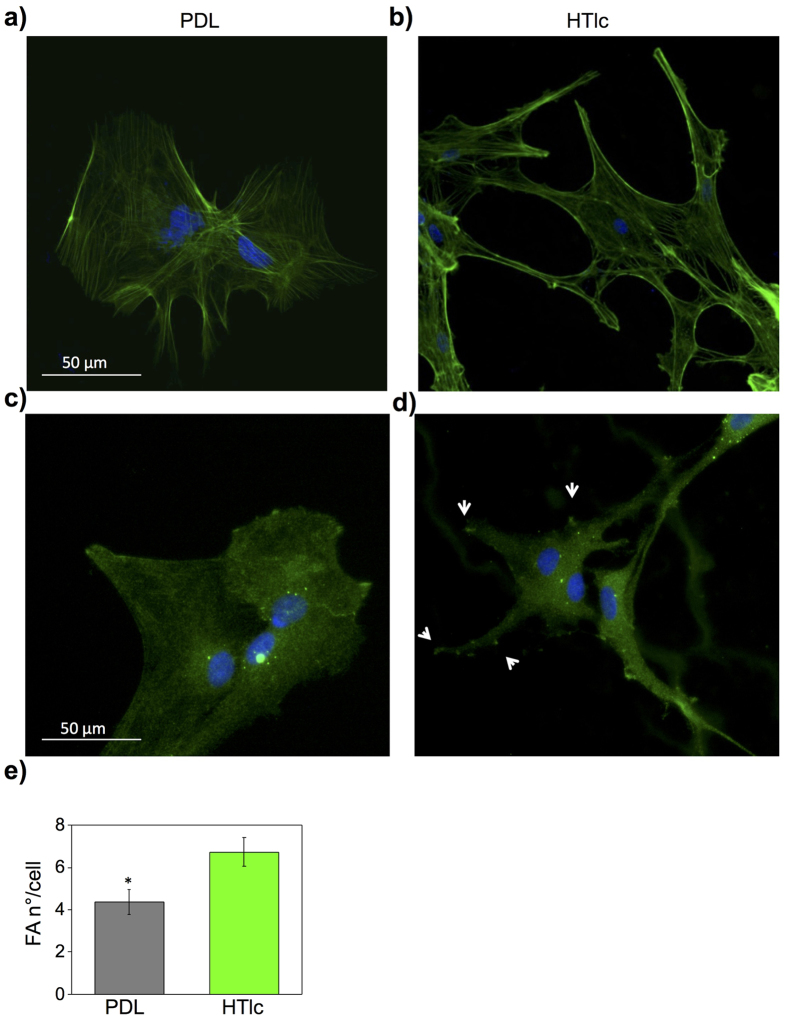
Figure 5. F-actin cytoskeleton and Vinculin proteins expression in astrocytes plated on PDL and HTlc.
Micrographs representing astrocytes imunostained for actin (a,b) and vinculin (c,d) grown on PDL (a,c) and HTlc fims (b,d). (e) Hstogram plot reporting the number of Focal Adhesion (FA) contacts per astrocyte, which were counted in cells plated on PDL (gray bars) and on HTlc films (green bars). Data are expressed as means ± SE (n = 25; *p < 0.05).

