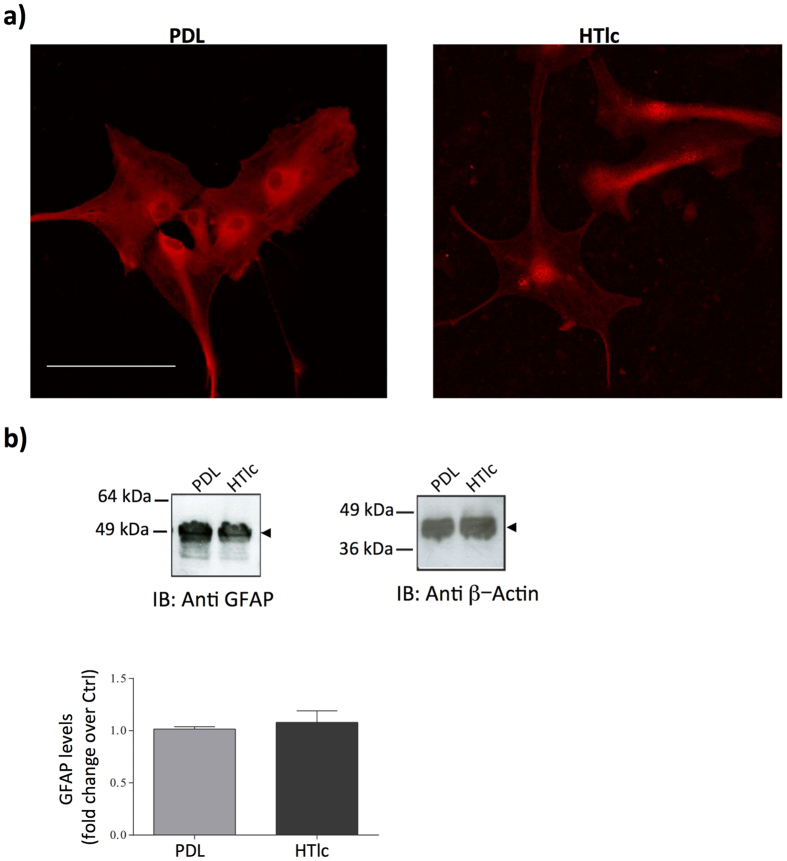
Figure 6. GFAP protein expression in astrocytes plated on PDL and HTlc.
(a) Confocal imaging of astrocytes stained with GFAP. Scale bar is 50 μm. (b) immunoblotting and quantification of the expression level of GFAP. β-actin (right panel) is used as control for signal normalization. Lower panel: histogram plots evidencing protein fold of change over the control. Note that the expression level of GFAP was not significantly different between PDL and HTlc (n = 3). Cropped images of the entire blots are reported. However, no other specific signals were observed within the blot length.

