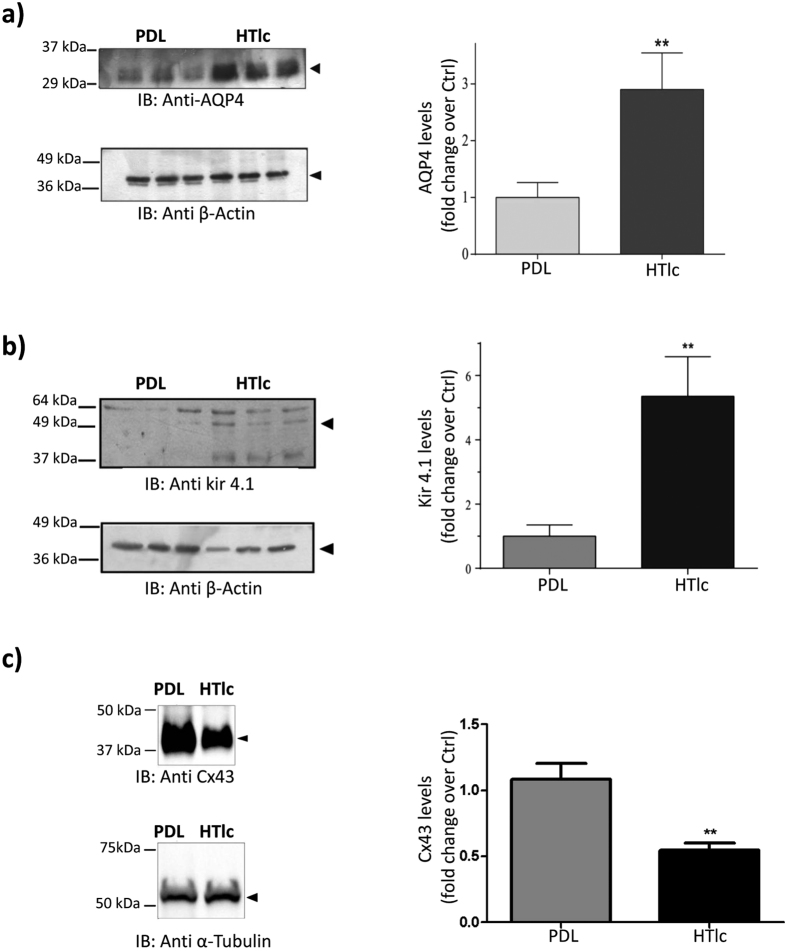
Figure 8.
Western blot analyses and quantification of protein expression of AQP4 (a) Kir4.1 (b) and Cx43 (c) on astrocytes plated on PDL and HTlc. β-actin (a,b, lower panels) and α-tubulin were re-blotted and used as controls for signal normalization. Histogram plots evidencing change in protein expression with respect to the control are reported in the right panels of the figures. Values are the mean ± SE. (n = 3; *p < 0.01). Cropped images of the entire blots are reported. However, no other specific signals were observed within the blot length.

