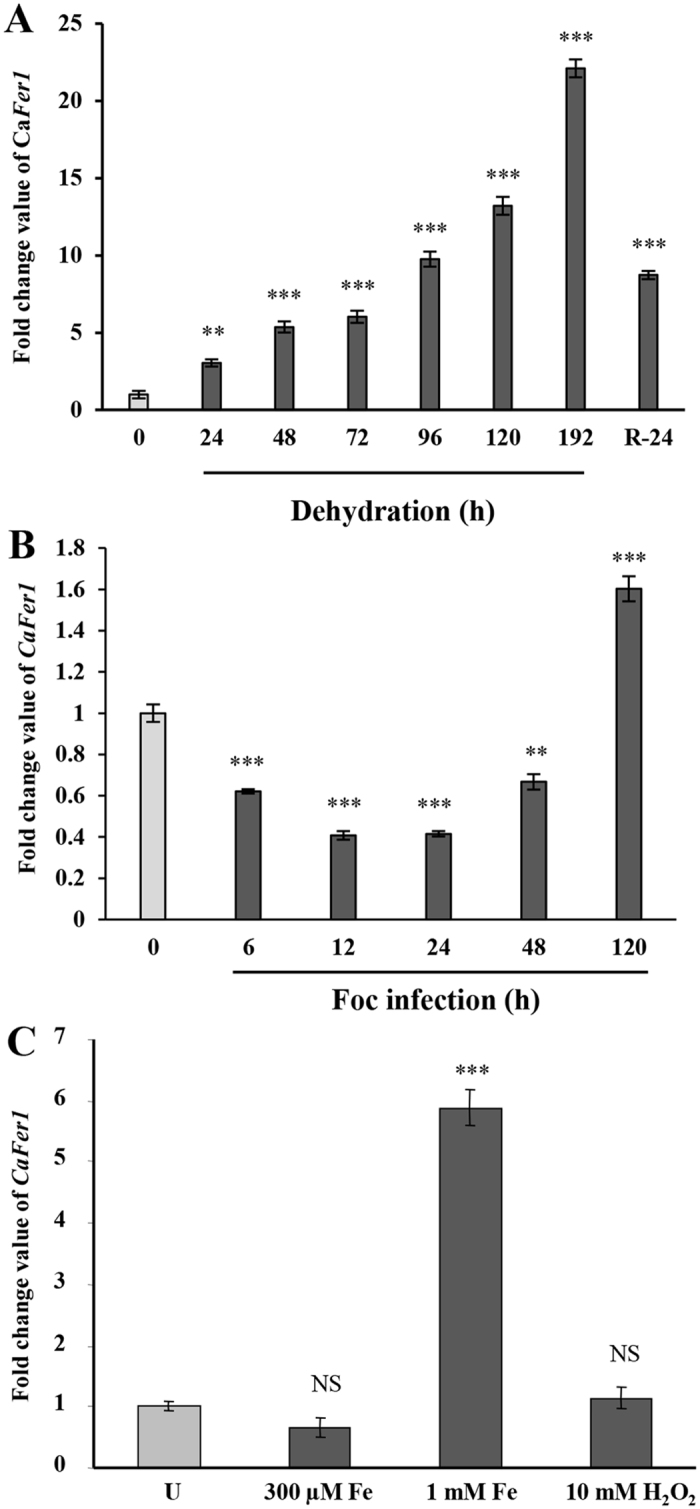
Figure 2. Stress-responsive altered expression of CaFer1.

(A) Time-dependent accumulation of CaFer1 transcript in response to dehydration, as indicated. (B) Fusarium oxysporum f. sp. ciceris (Foc) effected altered expression of CaFer1. (C) qRT-PCR analysis showing differential accumulation of CaFer1 transcript in response to Fe (300 μM and 1 mM) and 10 mM H2O2. The expression levels of CaFer1 were normalized to expression of EF1α. Error bars represent the SE from three replicates. Asterisks indicate significant differences relative to the untreated background (Student’s t test). NS, not significant; U, untreated.
