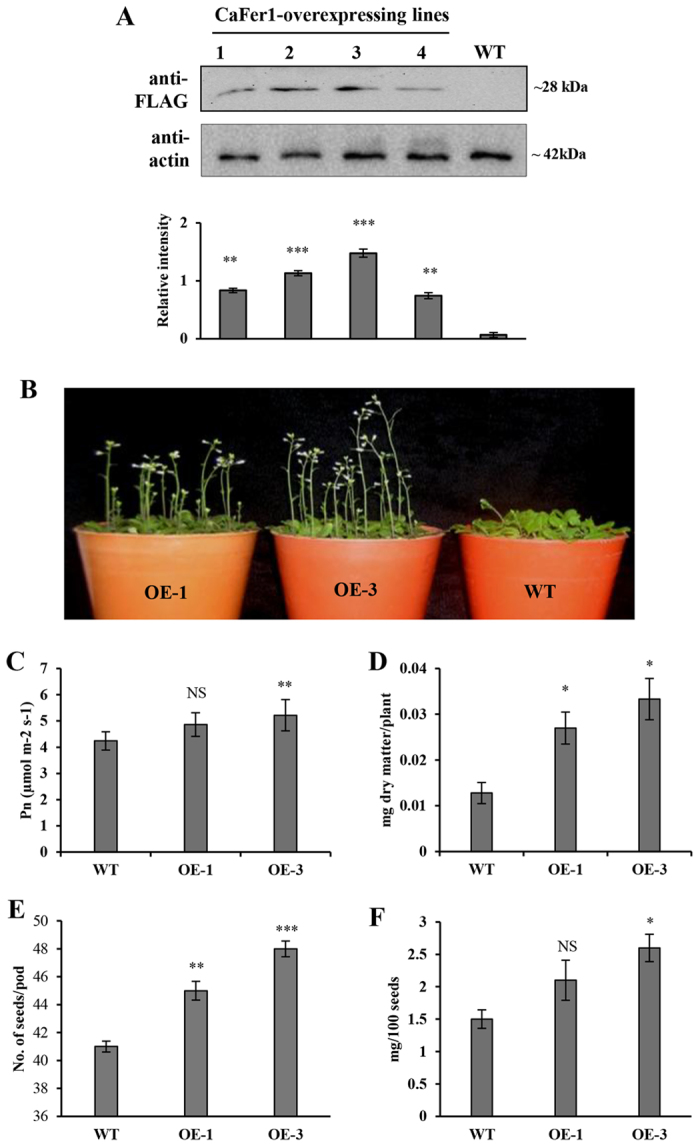
Figure 4. Physiological characterization of CaFer1-overexpressing seedlings.

(A) Screening of transgene expression by immunoblot analysis using anti-FLAG antibody. Actin served as loading control. The bar graph indicates the fold-expression as determined by band intensity of CaFer1. (B) Morphometric analysis of developing seedlings of WT and in two OE lines, OE-1 and OE-3. (C) Enhanced net photosynthetic rates in OE-3 plants. (D) Enhanced biomass production in OE-3 plants. (E) Increased seed number and (F) increased seed weight in OE-3 plants as compared to WT. Error bars represent the SE from three replicates. Asterisks indicate significant differences relative to the WT background (Student’s t test). NS, not significant; WT, wild-type; OE, CaFer1-overexpressing.
