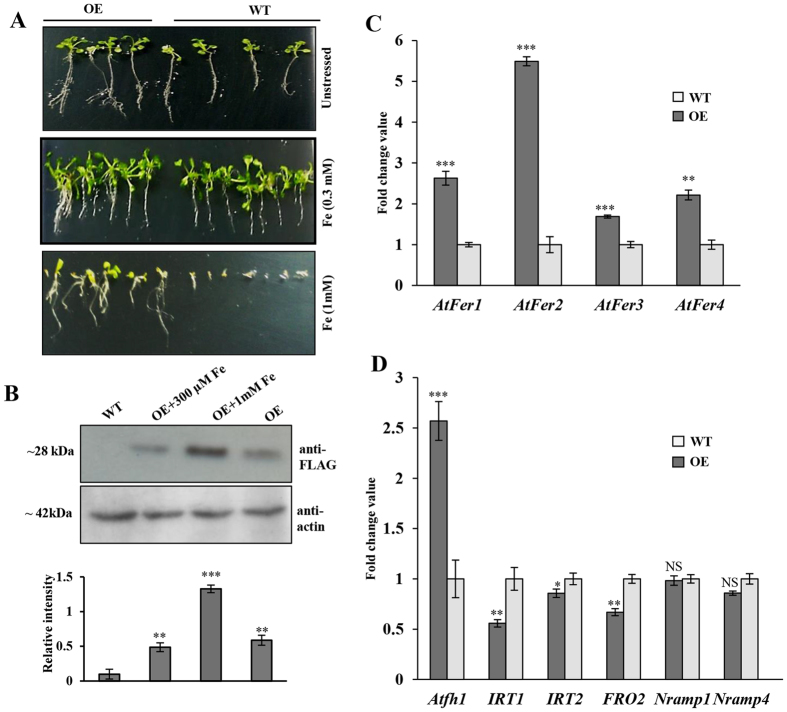
Figure 6. Iron-responsive phenotypes of CaFer1-overexpressing plants, and expression analysis of iron-responsive genes.
(A) WT and OE seedlings were grown on MS media supplemented with different concentration of Fe. Plate assays were done in, at least, four replicates and results of one representative experiment is shown. (B) CaFer1 expression in OE seedlings treated with 300 μM and 1 mM Fe when compared with untreated OE and WT seedlings. Actin served as loading control. The bar graphs indicate the fold-expression as determined by band intensity of CaFer1. (C) Expression of ferritin genes (AtFer1–4) in OE and WT seedlings as determined by qRT-PCR. (D) Expression analysis of Fe-responsive genes in OE and WT seedlings. The expression levels of genes were normalized using the signal from the actin or ubiquitin genes. Error bars represent the SE from three replicates. Asterisks indicate significant differences relative to the WT (Student’s t test). NS, not significant; WT, wild-type; OE, CaFer1-overexpressing.

