Figure 1.
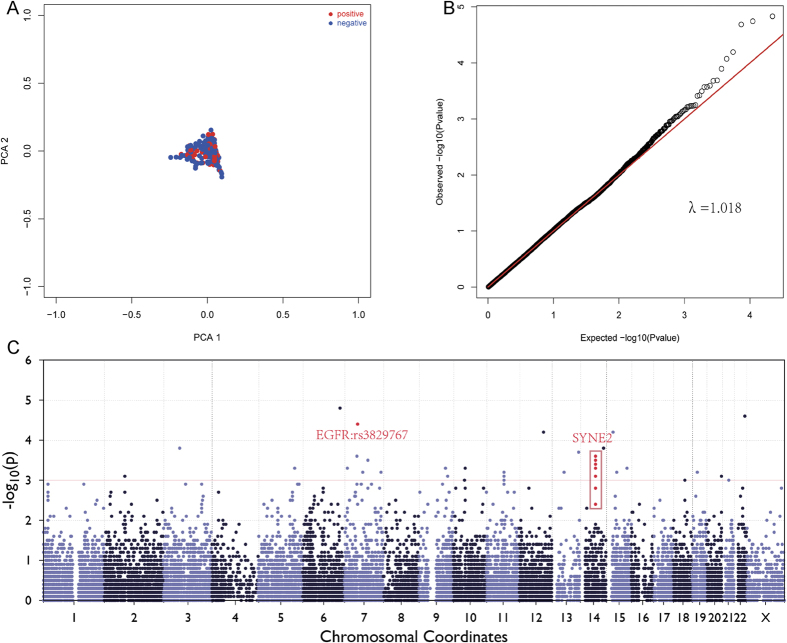
(A) Principal components analysis (PCA) for ancestry and population stratification implemented in EIGENSOFT package. The blue dot represents controls and red dot represents patients. No or mild population stratification was found in this study population. (B) Quantile-Quantile (Q-Q) plots from Single Variant Test. Reported genomic inflation factor was calculated by MATLAB 7.0, based on P value, and the genomic control inflation factor (λ) was 1.018. (C) Manhattan plots for association analysis. Results from Single Variant Test (−log10 P values) were plotted against genomic position (GRCh37/hg19).

