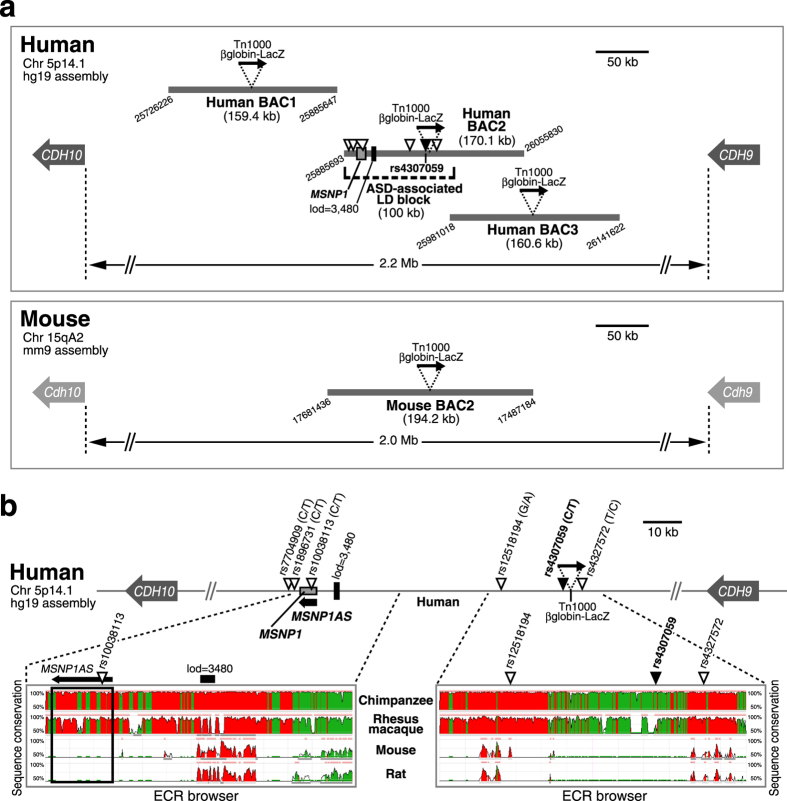
Figure 1. Schematic overview of the intergenic BACs used in enhancer-trapping for the 5p14.1 ASD-associated gene desert.
(a) The upper panel shows human intergenic region between CDH10 and CDH9, apart from 2.2 megabase (Mb) on the chromosome 5p14.1. Three Human BACs depicted by bold gray lines are chosen for this study. The downward triangles on Human BAC2 indicate ASD-associated GWAS SNPs and particularly the black one denotes the most significant association SNP, rs4307059. All the risk SNPs reside within the same 100 kilobase (kb) linkage disequilibrium (LD) block. Only Human BAC2 covers all the six risk SNPs and moesin pseudogene 1 (MSNP1), whereas the adjacent Human BAC1 and Human BAC3 do not contain them. The attached digits at the edges of BACs mean the chromosomal location by UCSC Genome Browser hg19 assembly. All the BACs are tagged by in vitro transposition of Tn1000 βglobin-LacZ (black arrow) for enhancer-trapping. Lod score 3,480 on Human BAC2 represents a highly conserved genomic element by phastCons in UCSC Genome browser. The lower panel shows mouse intergenic region between Cdh10 and Cdh9. Mouse BAC2 equivalent to Human BAC2 is selected in consideration of the evolutional conservation to the maximum extent, and also tagged by βglobin-LacZ cassette. The attached digits represent the chromosomal location by UCSC Genome Browser mm9 assembly. (b) In the upper column, (minor/major allele) is shown for each SNP. As an example, for rs4307059, the minor allele is C and the major allele is T. Tn1000 βglobin-LacZ gene cassette never override any risk SNPs. A 3.9 kb non-coding RNA, moesin pseudogene 1 antisense (MSNP1AS, bold black arrow) is encoded by the opposite (antisense) strand of MSNP1. In the lower column, bioinformatic analyses reveal that the human ASD risk SNPs’ regions are highly conserved among primates but not in rodents, particularly for the sequence from which MSNP1AS is transcribed (the region enclosed by the black rectangular line). Images were modified from ECR browser (ecrbrowser.decode.org). The vertical axes visualize the significant conservation from 50% to 100% identity. Red colored peaks are within intergenic regions, and peaks colored in green correspond to transposable elements or simple repeats.

