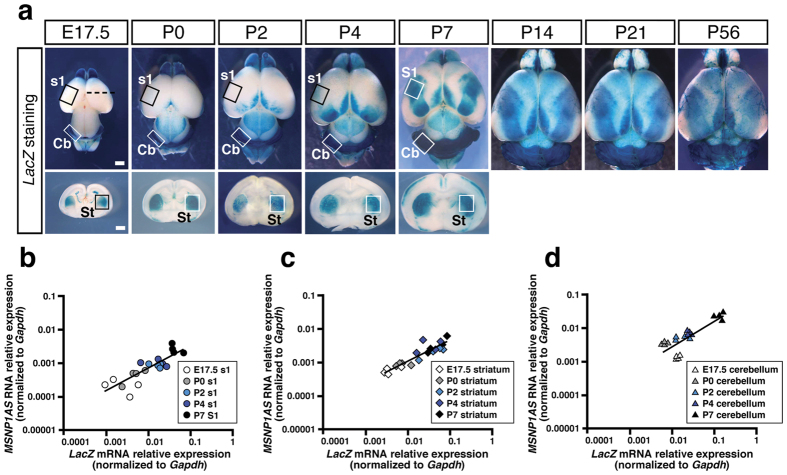
Figure 4. MSNP1AS is actually transcribed in Human BAC2 Tg mouse brains and the expression levels are well correlated with those of LacZ mRNA.
(a) Developmental LacZ expression patterns in Human BAC2 Tg brains. LacZ expressions in the cerebral cortex gradually become thicker and broader from E17.5 to P7, and are maintained to the adult stage (P14, P21, P56). At E17.5, the black dotted line in the upper panel corresponds to the coronal section level for the lower panel. LacZ expressions in the cerebellum (Cb) and striatum (St) are also kept at considerable levels through all the stages analysed. Total RNA samples are extracted from boxed areas tagged with S1 (s1), St and Cb from E17.5 to P7. S1; primary somatosensory cortex, s1; prospective regions for S1, St; striatum, Cb; cerebellum. Scale bars, 1 mm for whole brain and coronal section. (b) MSNP1AS transcript levels are positively associated with LacZ transcript levels in S1 (s1) samples from E17.5 to P7 (r = +0.75; P = 1.20 × 10⁻⁴). Data are shown relative to Gapdh expression. (c) Association of MSNP1AS transcript levels with LacZ transcript levels in the striatum (St) from E17.5 to P7 (r = +0.81; P = 1.33 × 10⁻⁵). Data are shown relative to Gapdh expression. (d) Association of MSNP1AS transcript levels with LacZ transcript levels in the cerebellum (Cb) from E17.5 to P7 (r = +0.93; P = 1.15 × 10⁻⁹). Data are shown relative to Gapdh expression.

