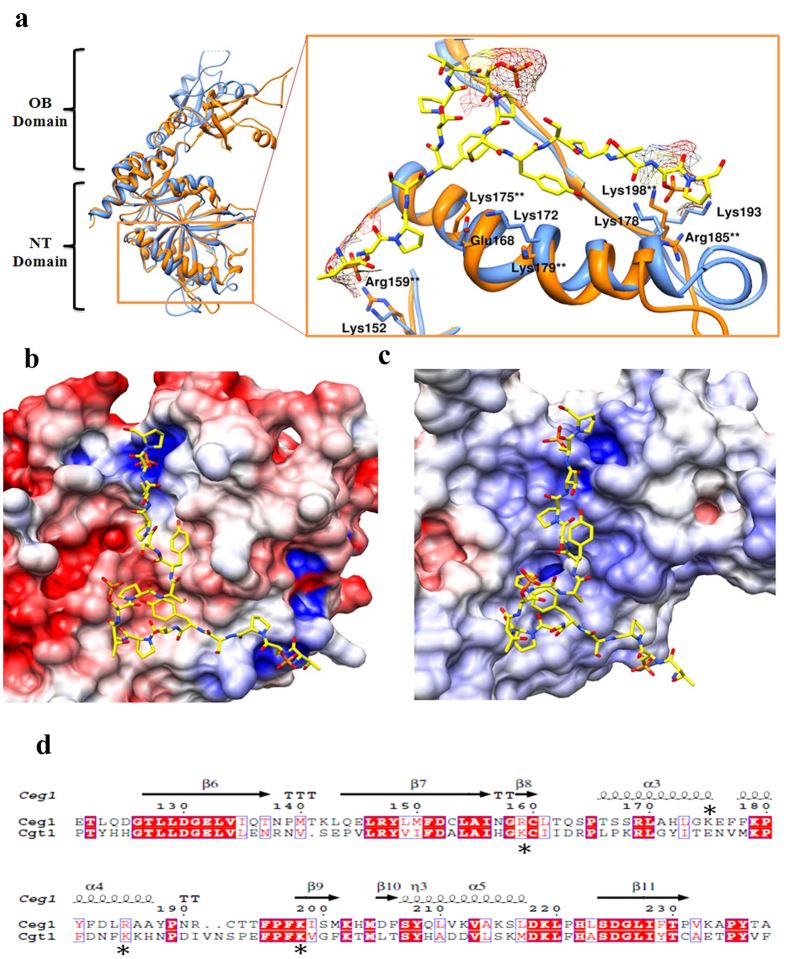
Figure 3. Structural superimposition shows key residues of Ceg1 interact with the phosphorylated CTD.
(a) The superimposition of the crystal structure of Cgt1 (sky blue) and Ceg1 (orange) with an enlarged region, shows the CTD binding region where **indicates the residues from Ceg1 interacting with phosphorylated CTD. (b) The surface electrostatic potential of the NT domain complex of Cgt1 with phosphorylated CTD sequence show clustered positive patches in the form of two pockets (c) The surface electrostatic potential of the NT domain complex of Ceg1 with phosphorylated CTD sequence however shows dispersed and clustered positive patches. (d) Sequence alignment of the residues of NT domain of Ceg1 and Cgt1. Residues in the red background are fully conserved and residues in red colour are semi conserved. Symbol (*) represents the location where mutations were carried out.

