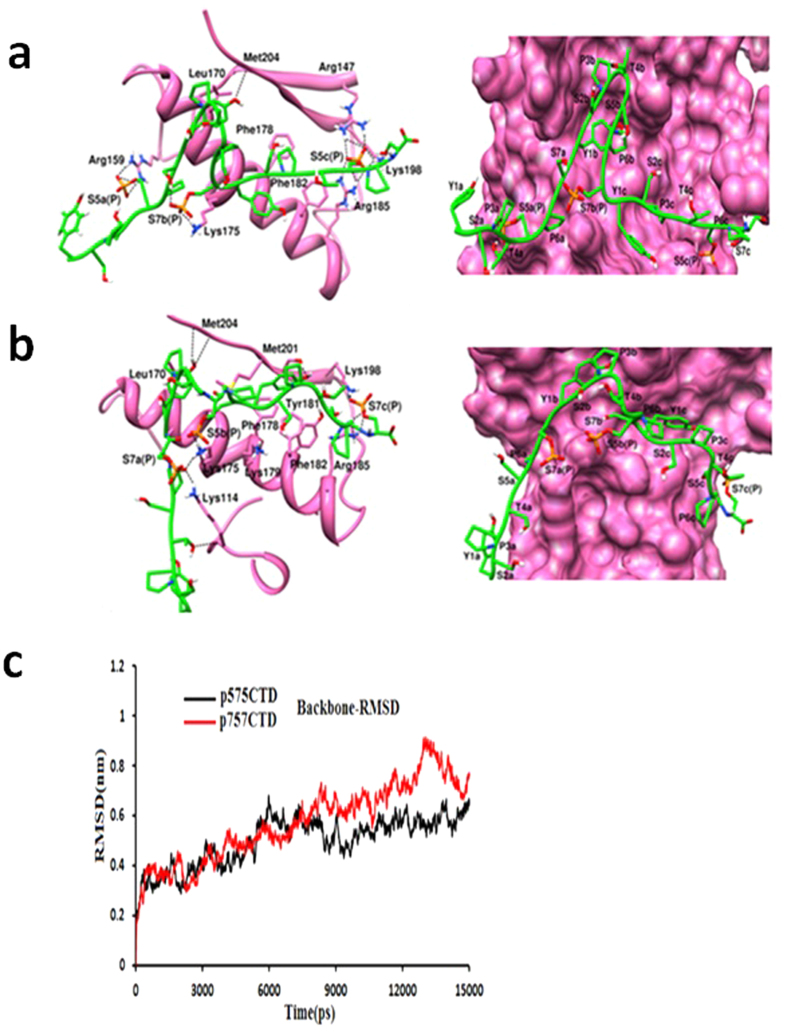
Figure 5. Phosphorylated CTD heptad shows a specific interaction pattern with Ceg1.
(a) The left panel shows the interaction profile of CTD1 (YSPTSPPS-YSPTSPSP-YSPTSPPS) with Ceg1-CID, obtained after 15 ns MD simulation. The right panel shows the surface view of Ceg1-CID (hot pink) with CTD1. H-bonds are shown in black dotted line. For clear representation only polar hydrogens are shown. (b) The right panel shows the interaction profile of CTD2 (YSPTSPSP-YSPTSPPS-YSPTSPSP) with Ceg1-CID, obtained after 15 ns MD simulation. The right panel shows the surface view of Ceg1-CID (hot pink) with CTD2. (c) Root mean square deviation of the backbone atoms of Ceg1-CTD1 (black) and Ceg1-CTD2 (red) complexes.

