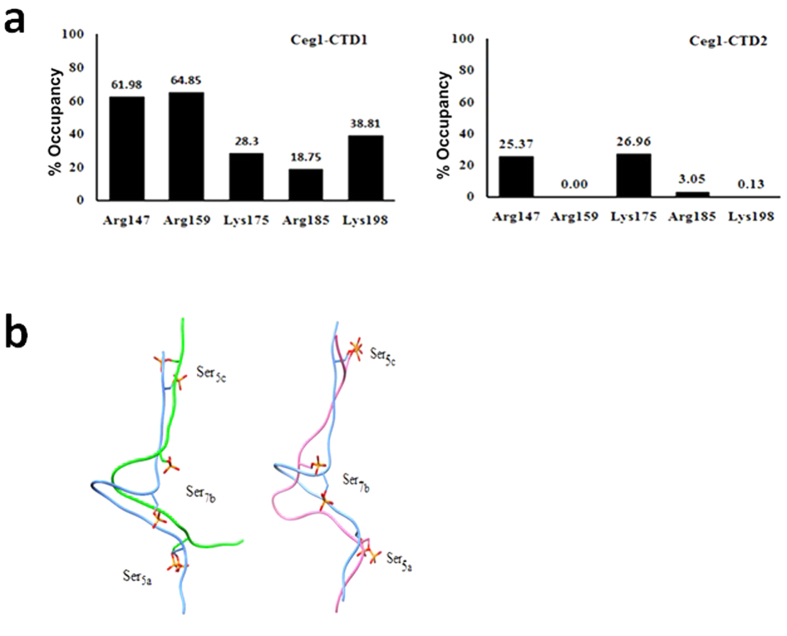
Figure 6. Ceg1 interacts more strongly with CTD1.
(a) H-bond occupancy plot during 15ns of MD simulation for Ceg1-CTD1 (left panel) and Ceg1-CTD2 (right panel). (b) The left panel shows the superimposed CTD1 conformations in case of Ceg1 (blue) and Ceg1R185A (green) after 15ns of MD simulation. The right panel shows the superimposed CTD1 conformation in case of Ceg1 (blue) and CegK198A (pink) at similar condition.

