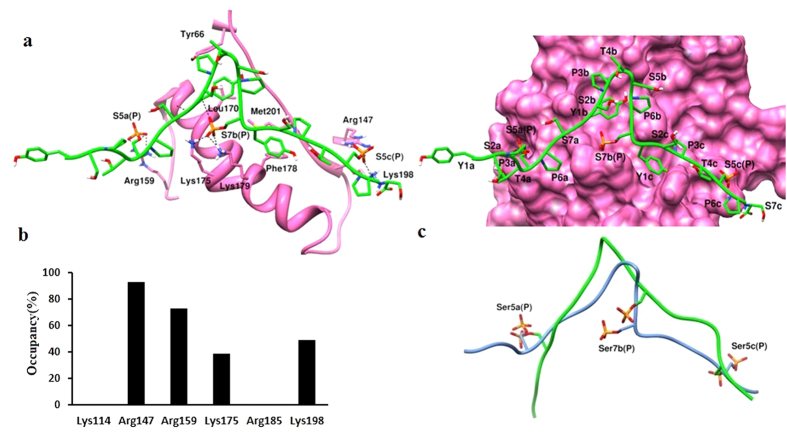
Figure 8. The mutation R185A alters the interaction of CTD1 with Ceg1.
(a) Left panel shows an interaction between CTD1 and Ceg1R185A. The right panel shows the conformation of CTD1 over the surface of Ceg1R185A. (b) H-bond occupancy analysis of Ceg1R185A-CTD1 interaction. (c) The aligned conformations of CTD1 with Ceg1 (green) and Ceg1R185A (blue). For the interaction analysis, the last frame obtained after 55 ns MD simulation was used.

