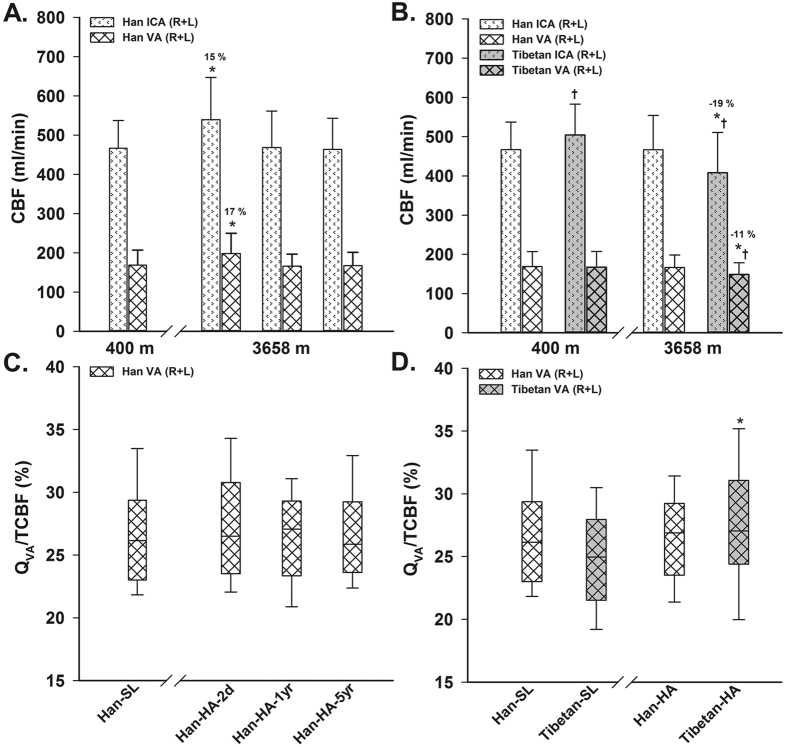
Figure 2.
Comparisons of regional cerebral blood flow (CBF) and its distribution on short- and long-term HA exposures in Han Chinese (A,C), and the race difference on long-term exposure (B,D). ICA = internal carotid artery; VA = vertebral artery; R + L = right and left sides = bilateral sides; TCBF = total CBF; QVA/TCBF = the percentage of bilateral VA CBFs to TCBF; SL = sea level (400 m); HA = high altitude (3658 m); Han-SL = Han natives staying at SL; Han-HA-2d = Han newcomers at HA for only 2 days; Han-HA-1yr = Han migrants at HA for 1 year; Han-HA-5yr = Han migrants at HA for 5 years; Tibetan-SL = Tibetan migrants at SL for 2 years; Han-HA = Han migrants at HA for 1 or 5 years; Tibetan-HA = Tibetan natives at HA. Values are mean ± SD. *P < 0.05 vs. the SL counterpart, % (in A,B) = percentage change of the mean value relative to the SL counterpart; †P < 0.05, Tibetans vs. Han Chinese at same altitude.

